CME Euro FX Futures 6E
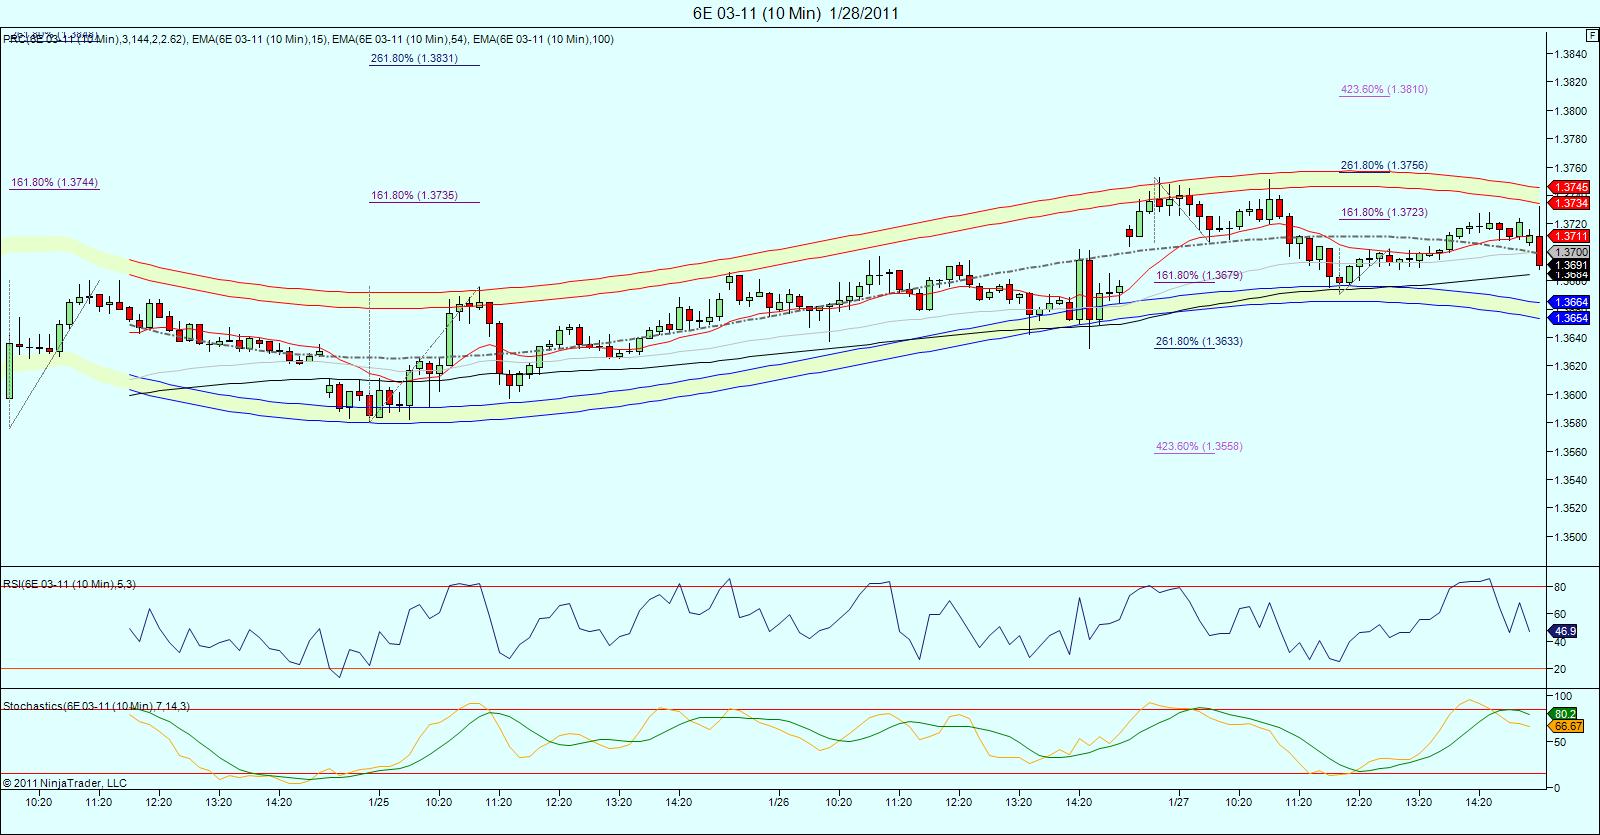
Red, sorry ,i was already asleep when you posted!.. I haven't had much time to look at it, but the daily chart indicates 1.3826 coming. Cycles are not very clear.... here's a real short term peak (10 min chart).. id be buying anywhere around the lower prc band...
Click image for original size
I think I use them different that most do, take the Eur/Usd for example trading above the PP but below R1 thats slightly bullish to me.
Originally posted by CharterJoe
Red its ez, Take yesterdays range divide by two add that to the high and low and then find the 50% price thats the pivot point...the price added to the high is Resistance #1 and do it again is R2 subtract from the low it is S1 and S2 been using them for years. Used to be only pit traders that did these numbers.
=====================================================================
Yes I have done that. I didn't call it pivot, I didn't call
it anything I don't guess .. LOL ..
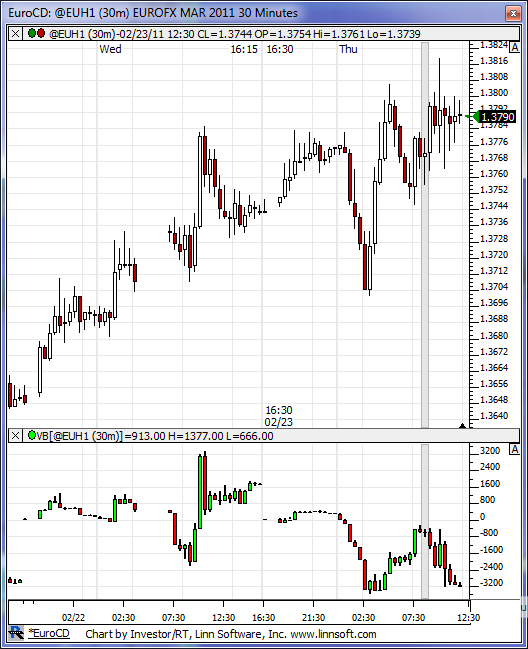
dbl top? Nice reversal on the 30min. scalping shorts till we get too targeting 3727. After the 10pm news that is....
Click image for original size
up volume looks bull .. chart looks weak
sorry bout that .. click on the chart and you can see what I
was trying to show which is the up/down volume
was trying to show which is the up/down volume
Plenty of good scalp trades since 10:00. 7 x 30min overlapping gonna break out soon.
Red, here is a cumulative delta chart on the 6E set to 30 min time frame. Definitely showing selling pressure but prices not budging.
Click image for original size
as long as we are above 1.3781 that is bullish to me
1.3845, then eventually 1.3858, the test of the recent high
Originally posted by redsixspeed
as long as we are above 1.3781 that is bullish to me
LOL ....are you long at 781??
- Page(s):
- 20
- 21
- 22
- 23
- 24
- 25
- 26
- 27
- 28
- 29
- 30
- 31
- 32
- 33
- 34
- 35
- 36
- 37
- 38
- 39
- 40
- 41
- 42
- 43
- 44
- 45
- 46
- 47
- 48
- 49
- 50
- 51
- 52
- 53
- 54
- 55
- 56
- 57
- 58
- 59
- 60
- 61
- 62
- 63
- 64
- 65
- 66
- 67
- 68
- 69
At $85 billion/month, it cost Bernanke a little over $1 million for each job created last month. Well done, professor. -Tim Knight
Emini Day Trading /
Daily Notes /
Forecast /
Economic Events /
Search /
Terms and Conditions /
Disclaimer /
Books /
Online Books /
Site Map /
Contact /
Privacy Policy /
Links /
About /
Day Trading Forum /
Investment Calculators /
Pivot Point Calculator /
Market Profile Generator /
Fibonacci Calculator /
Mailing List /
Advertise Here /
Articles /
Financial Terms /
Brokers /
Software /
Holidays /
Stock Split Calendar /
Mortgage Calculator /
Donate
Copyright © 2004-2023, MyPivots. All rights reserved.
Copyright © 2004-2023, MyPivots. All rights reserved.