CME Euro FX Futures 6E
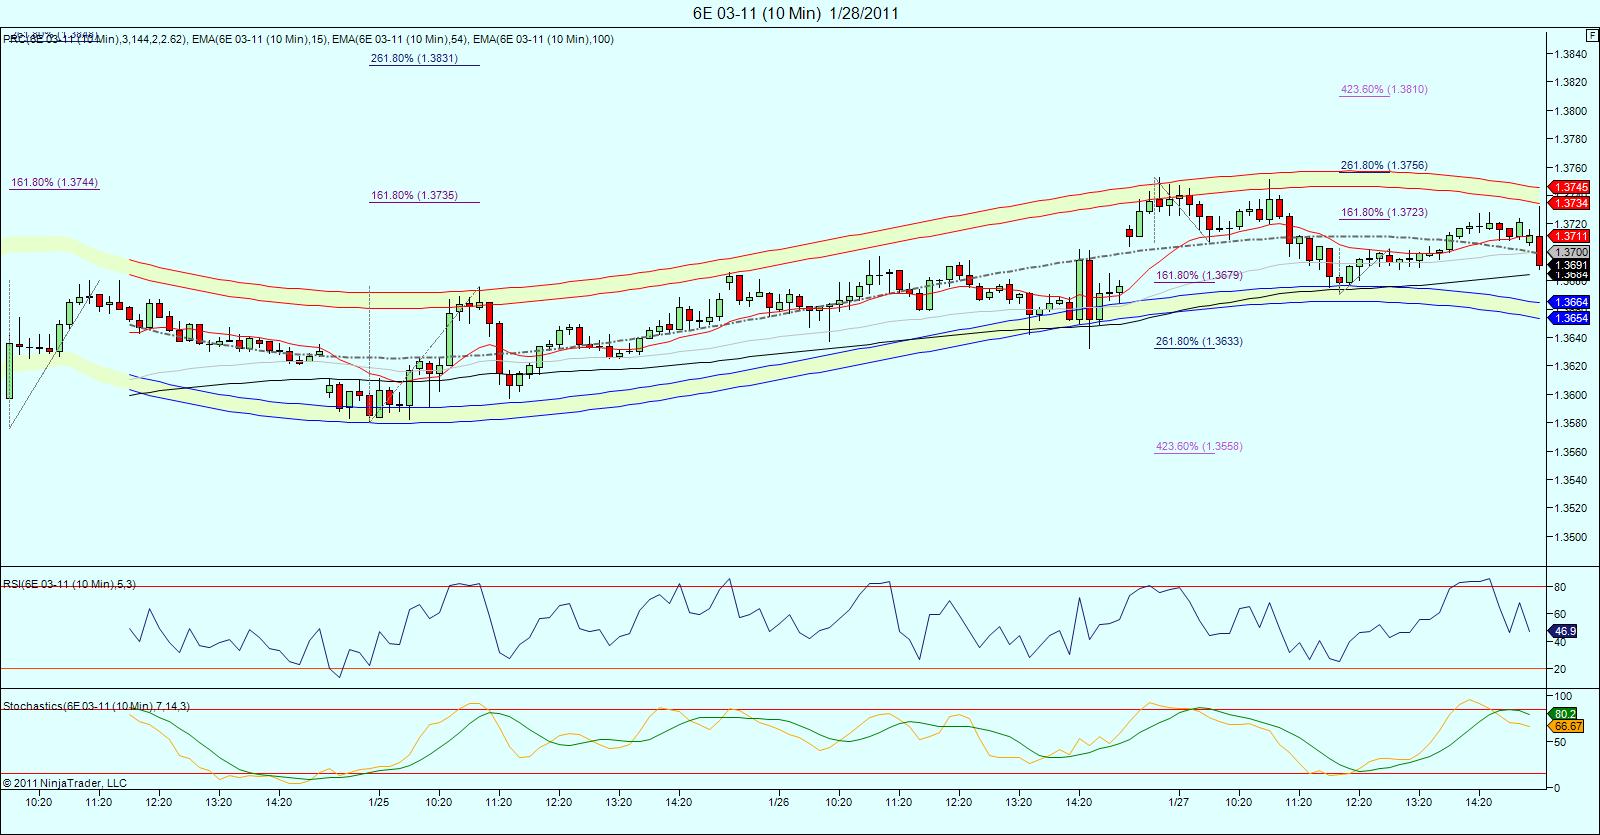
Red, sorry ,i was already asleep when you posted!.. I haven't had much time to look at it, but the daily chart indicates 1.3826 coming. Cycles are not very clear.... here's a real short term peak (10 min chart).. id be buying anywhere around the lower prc band...
Click image for original size
Originally posted by redsixspeed
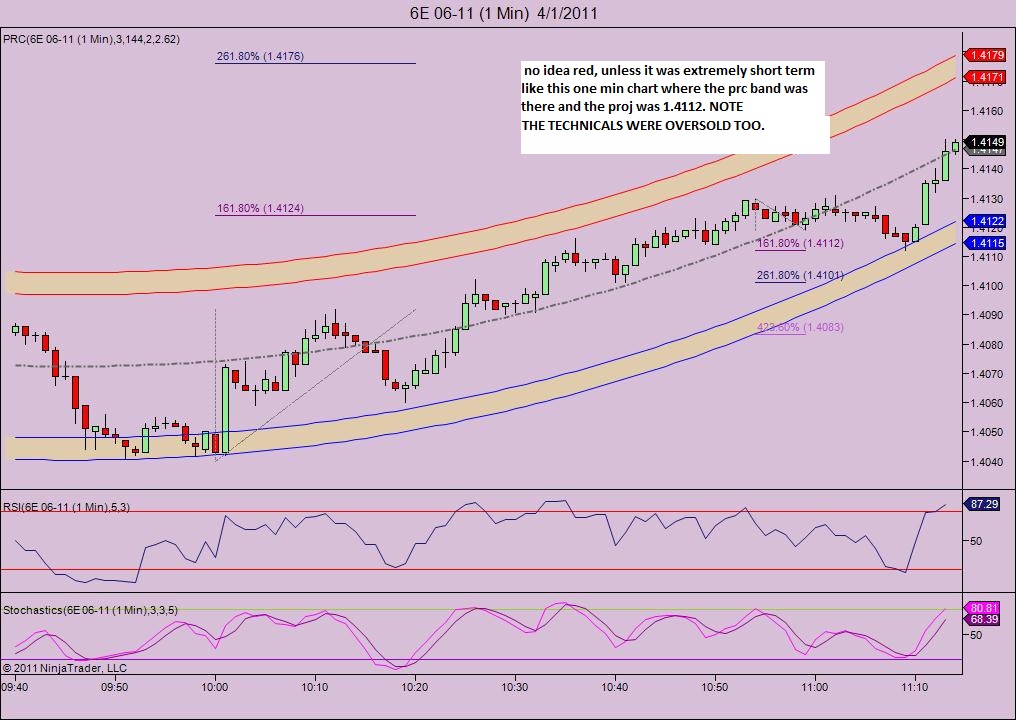
38.2 projection @ 1.4106 .. r2 @ 1.4109 .. equal distance move @
1.4110 and a mid point # @ 1.4112 .. I'am pulling for the mid #
====================================================================
there the 1.4112 I was pulling for .. hope it goes higher
since that 5min. accumulation signal along with the daily bullish counter attck I started looking for more up ..
.. stay above 1.412 put next longer range target @ 1.443 with a
possible battle @ the 1.429 area .. below 1.412 or especially take out the low of either bullish pattern will be cause for caution ...
.. stay above 1.412 put next longer range target @ 1.443 with a
possible battle @ the 1.429 area .. below 1.412 or especially take out the low of either bullish pattern will be cause for caution ...
Originally posted by redsixspeed
since that 5min. accumulation signal along with the daily bullish counter attck I started looking for more up ..
.. stay above 1.412 put next longer range target @ 1.443 with a
possible battle @ the 1.429 area .. below 1.412 or especially take out the low of either bullish pattern will be cause for caution ...
====================================================================== dang !! I have to re-do my caculations will post again later
edit caculations ^^
stay above 1.412 keeps 1.427 on radar .. next long range target 1.455 .. take out the low of the bull candle patterns change
things ..
stay above 1.412 keeps 1.427 on radar .. next long range target 1.455 .. take out the low of the bull candle patterns change
things ..
6e is at the support area of the "counter attack" daily pattern at 1.4067 .. there is a stretch # at 1.4069 and s3 at 1.4069
support at 1.4026 of that accumulation pattern
mid point of the two candle patterns support area = 1.4047
Originally posted by redsixspeed..wow! amazing call, RED!!!
mid point of the two candle patterns support area = 1.4047
I have a question and would appreciate any response:
I just read this post in another room :
" I am going long 6e at 1.4145"
I looked at my chart an I don't see anything there, in fact
I see a resistance area at 1.4153 ..
Why would he/she go long at 1.4145 ..
I just read this post in another room :
" I am going long 6e at 1.4145"
I looked at my chart an I don't see anything there, in fact
I see a resistance area at 1.4153 ..
Why would he/she go long at 1.4145 ..
Originally posted by redsixspeed
I have a question and would appreciate any response:
I just read this post in another room :
" I am going long 6e at 1.4145"
I looked at my chart an I don't see anything there, in fact
I see a resistance area at 1.4153 ..
Why would he/she go long at 1.4145 ..
Click image for original size
- Page(s):
- 35
- 36
- 37
- 38
- 39
- 40
- 41
- 42
- 43
- 44
- 45
- 46
- 47
- 48
- 49
- 50
- 51
- 52
- 53
- 54
- 55
- 56
- 57
- 58
- 59
- 60
- 61
- 62
- 63
- 64
- 65
- 66
- 67
- 68
- 69
At $85 billion/month, it cost Bernanke a little over $1 million for each job created last month. Well done, professor. -Tim Knight
Emini Day Trading /
Daily Notes /
Forecast /
Economic Events /
Search /
Terms and Conditions /
Disclaimer /
Books /
Online Books /
Site Map /
Contact /
Privacy Policy /
Links /
About /
Day Trading Forum /
Investment Calculators /
Pivot Point Calculator /
Market Profile Generator /
Fibonacci Calculator /
Mailing List /
Advertise Here /
Articles /
Financial Terms /
Brokers /
Software /
Holidays /
Stock Split Calendar /
Mortgage Calculator /
Donate
Copyright © 2004-2023, MyPivots. All rights reserved.
Copyright © 2004-2023, MyPivots. All rights reserved.