ES short term trading 1-28-11
If you refer to yesterdays 9:16 post showing the projection off of the low, and the 9:36 post also i refer to the 1298.50 level.. it should come as no surprise that once again we just made a marginal new high at 1298.50 .. currently short from 1298.25 trying for 1295.50.... beyond that,my analysis of the last few days and weeks APPEARS TO BE IN FORCE, SO I WONT RE- HASH IT TODAY. The upper channel line i showed yesterday looks to be around 1301.50 currently. Still looking for sideways to up thru tues next week!
Hi! Can you post your charts? like the others? thank you! :)
Originally posted by WS
Kool. Don't you have a charting platform in front of you? Trace the line in a 10M chart! Ok, so I mentioned 1277.00 S/R, you guys will have something like S3 support @ 1276.50 That's very close in my book. Oh well, what can I say.........
Originally posted by koolblue
Originally posted by WSRelax, man!.. were just trying to share ideas here(whether right or wrong!) Here's an example .. id like to see the trendline .Is it the same one i had posted, or different? And how do you get those targets? From the charts i showed ,or some similar method? or some completely different method? i dont see any chart reason to pick those. I ,for one, just want to learn! Im smart enough to know i dont know everything!!!
Notice that it's hitting the resistance trend line in the lower intraday charts. (10M.) @ 1277.00 or so.
1277.00 is a intraday S/R, so a test will take place here and possibly a test of the recent low 1272.50.
To the outside : Moving above 1277.00 and 1279.25, will target 1283.00 and 1287.00.
Moving below 1272.50 will void the above.
I'm currently flat and waiting for the proper set up.
ES trading 1277.25 @ 12:33
Maybe a layout before starting to post a trade. Will not post charts as the trade unfolds. You guys can look at your charts and compare the time and price I'm posting. Posting the time and the price at the time of the post speaks volumes as to what 's actually happening. Not like: Oh. i'm out right about here LOL uh? Ok, enough. Will see what I can do next week....... I wish you all the best weekend of your life! Time to go play! Yeeeehaaaa!
Originally posted by NIGEL68
Hi! Can you post your charts? like the others? thank you! :)
Originally posted by WS
Kool. Don't you have a charting platform in front of you? Trace the line in a 10M chart! Ok, so I mentioned 1277.00 S/R, you guys will have something like S3 support @ 1276.50 That's very close in my book. Oh well, what can I say.........
Originally posted by koolblue
Originally posted by WSRelax, man!.. were just trying to share ideas here(whether right or wrong!) Here's an example .. id like to see the trendline .Is it the same one i had posted, or different? And how do you get those targets? From the charts i showed ,or some similar method? or some completely different method? i dont see any chart reason to pick those. I ,for one, just want to learn! Im smart enough to know i dont know everything!!!
Notice that it's hitting the resistance trend line in the lower intraday charts. (10M.) @ 1277.00 or so.
1277.00 is a intraday S/R, so a test will take place here and possibly a test of the recent low 1272.50.
To the outside : Moving above 1277.00 and 1279.25, will target 1283.00 and 1287.00.
Moving below 1272.50 will void the above.
I'm currently flat and waiting for the proper set up.
ES trading 1277.25 @ 12:33
WS, u still haven't answered my questions ? Unfortunately I've been down this path before and it usually doesn't end well...
lets hope this time it's different...not the positive vibe I wanted to end the week in the forum on....this should have gone better
lets hope this time it's different...not the positive vibe I wanted to end the week in the forum on....this should have gone better
why wont he answer my question? 1283 1287?
a common theme to us MP players is the concept of trend and consolidation. You will see this on all time frames but if you look at your 30 minute chart today you see a nice example.
The market opens and trends down, then consolidates in a 6 point range for 3 1/2 hours. Here is a link to a PDF that explains the concept.
It is my experience that we don't always get a very well defined step 4 ( read the PDF for reference). Many times we just start a new Step 1 and skip step 4. we can't always know what direction that will be. Still it is good to know what we can come to expect after a trend and that would be consolidation...
Here is the link but keep my thoughts about step 4 in mind when you read it.
http://www.elitetrader.com/vb/attachment.php?s=70d9b4ed5dd202fbe14f769af0f43c03&postid=921848
Well that's it for me....didn't do anything since this morning but now trying to redeem myself with that PDF in relation to the forum..I want this to be a positive place and hope I didn't bring bad vibes in here today
I hope all have a great weekend..
I hope all have a great weekend..
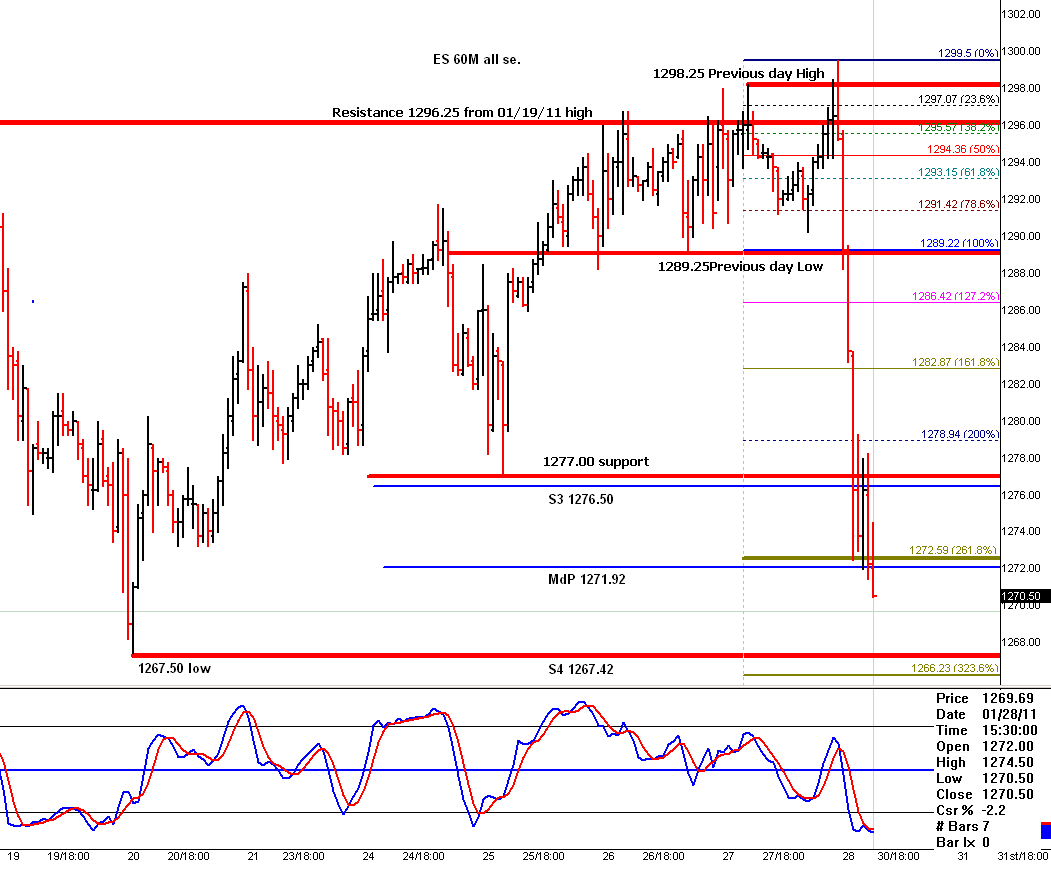
Here is a 60m chart that goes with my post. Notice how the market straggled to overcome the 1296.50 resistance from 01/19/11. I think others here had the same resistance in their charts.
Notice that today, in the afternoon, the ES hit the 1272 area and try to find support. That's where I took the posted trade from. Notice also that the market keep testing that support 1272.50, the support was a failure, and now it's moving down towards next support at 1267.00. Possibly O/N Sunday.
One more thing. Look at the isolator and you will see that it confirmed the down trend by the crossing of the red line over the blue line, and now it's in the oversold area and it's about to turn north. But, we still have to find support first, then a possible retrace will take place.
As you can see my charts aren't not as sophisticated as some others very prety charts I have seeing here at "Da' Forum"
I hope this helps.
Originally posted by WS
Giving it a shot here, long 1273.25. Stop 1272.25.
if 1272.50 is the low then it should not go any lower than that, at list for now. Will see, in due time the market will show us the way.
ES trading 1275.25 @ 13:31
ES tradingOriginally posted by WS
Notice that it's hitting the resistance trend line in the lower intraday charts. (10M.) @ 1277.00 or so.
1277.00 is a intraday S/R, so a test will take place here and possibly a test of the recent low 1272.50.
To the outside : Moving above 1277.00 and 1279.25, will target 1283.00 and 1287.00.
Moving below 1272.50 will void the above.
I'm currently flat and waiting for the proper set up.
ES trading 1277.25 @ 12:33
Click image for original size
Thx WS! by the way , pretty isnt always better. So your using fib retracements for those 1283 and 1287 targets? Makes sense.... anyway, thanks for the explanation and chart! Thats all i was after! see ya next week!
Originally posted by koolblue
why wont he answer my question? 1283 1287?
Wasn't 1283.25 a Naked POC as well?
Thank you for the pic and explanation!
A PICTURE IS WORTH A THOUSAND WORDS...I thought your chart looked "clean"..thanks for posting it
Emini Day Trading /
Daily Notes /
Forecast /
Economic Events /
Search /
Terms and Conditions /
Disclaimer /
Books /
Online Books /
Site Map /
Contact /
Privacy Policy /
Links /
About /
Day Trading Forum /
Investment Calculators /
Pivot Point Calculator /
Market Profile Generator /
Fibonacci Calculator /
Mailing List /
Advertise Here /
Articles /
Financial Terms /
Brokers /
Software /
Holidays /
Stock Split Calendar /
Mortgage Calculator /
Donate
Copyright © 2004-2023, MyPivots. All rights reserved.
Copyright © 2004-2023, MyPivots. All rights reserved.