The thirty minute closes
Here is a work in progress idea that I'm using to help qualify fade trades and hold trades that may be initiated from inside the key ranges. On a fade trade the basic idea is that you want to see the 30 minute bars close back inside key ranges after an attempted break of those ranges.
You would also like to see the bars close above and below the key ranges if you have taken trades from INSIDE of those ranges. So if you were a buyer for example inside a 60 minute range then you want to see the 30 minute bars close outside the 60 minute highs in order to hold runners for longer term targets.
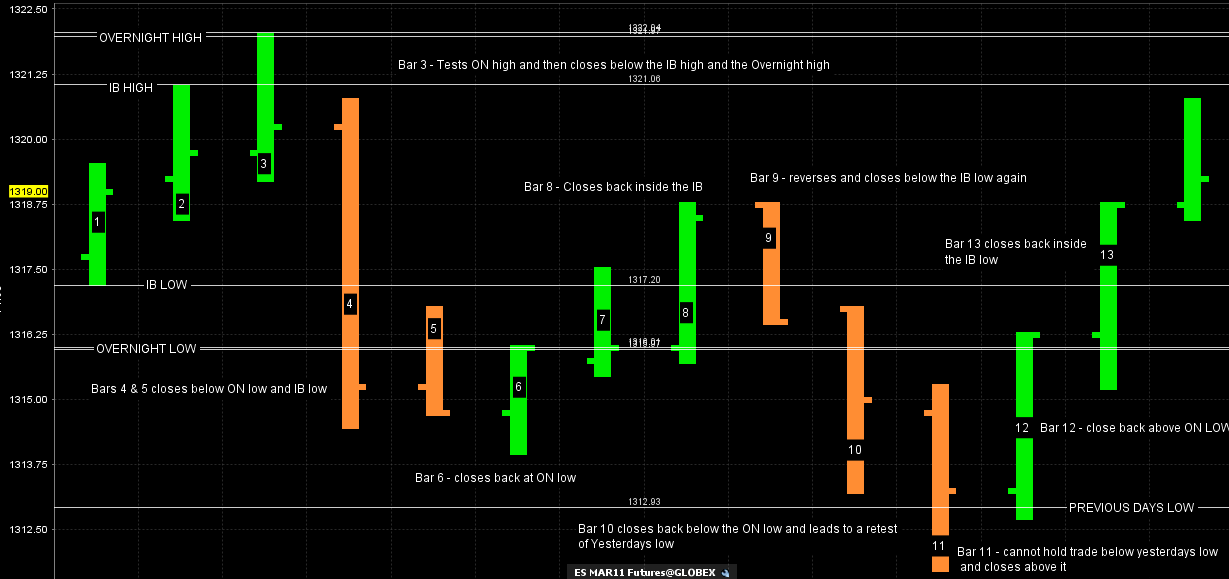
The key ranges include the previous days RTH high and low, the most recent Overnight high and low and the 60 minute (IB)high and low. This takes advantage of the markets inability to break out of these key ranges. When true break outs happen we will see single prints form and move to the next target. We will also see consecutive higher or lower closes depending on the direction of the breakout.
I'll add to this thread as I go but as a quick example from today we saw bar number 3 attempt to break out of the IB high and the Overnight high. It failed and closed back below the IB high and below the O/N high. So those of us who fade breakouts WANT to see that and it helps as a filter to hold runners without watching the market for every squiggle that the market moves.
The real market students will find additional ways to use this information and hopefully share it with the forum. This was inspired by the daily close concept. Many traders like to see daily closes above and below key market points to potentially signal breakout moves. So I'm using this with the key intraday ranges. Afterall, we need to get 30 minute closes above or below key areas before we can get daily closes in the same direction. Hopefully we'll get an example of a trend day soon.
This chart below has lots of good examples as today was a neutral day and had some good and bad reversals. It's a bit busy but hopefully can be understood.
You would also like to see the bars close above and below the key ranges if you have taken trades from INSIDE of those ranges. So if you were a buyer for example inside a 60 minute range then you want to see the 30 minute bars close outside the 60 minute highs in order to hold runners for longer term targets.
The key ranges include the previous days RTH high and low, the most recent Overnight high and low and the 60 minute (IB)high and low. This takes advantage of the markets inability to break out of these key ranges. When true break outs happen we will see single prints form and move to the next target. We will also see consecutive higher or lower closes depending on the direction of the breakout.
I'll add to this thread as I go but as a quick example from today we saw bar number 3 attempt to break out of the IB high and the Overnight high. It failed and closed back below the IB high and below the O/N high. So those of us who fade breakouts WANT to see that and it helps as a filter to hold runners without watching the market for every squiggle that the market moves.
The real market students will find additional ways to use this information and hopefully share it with the forum. This was inspired by the daily close concept. Many traders like to see daily closes above and below key market points to potentially signal breakout moves. So I'm using this with the key intraday ranges. Afterall, we need to get 30 minute closes above or below key areas before we can get daily closes in the same direction. Hopefully we'll get an example of a trend day soon.
This chart below has lots of good examples as today was a neutral day and had some good and bad reversals. It's a bit busy but hopefully can be understood.
Click image for original size
I use the 9:30 - 4:15 EST but I'm not usually trading the entire day...especially the last 15 minutes.On my charts on this thread the last 30 minute bar on the charts is really only 15 minutes of time....that's just the way IB does it..
Originally posted by piperian
Bruce, since the RTH's close at :15 past the hour, what are your chart times set for !?!
RTH Open to Close?
Here is todays chart and even if you think the 30 minute close concept is garbage you may get something from the lines I have drawn on this chart.
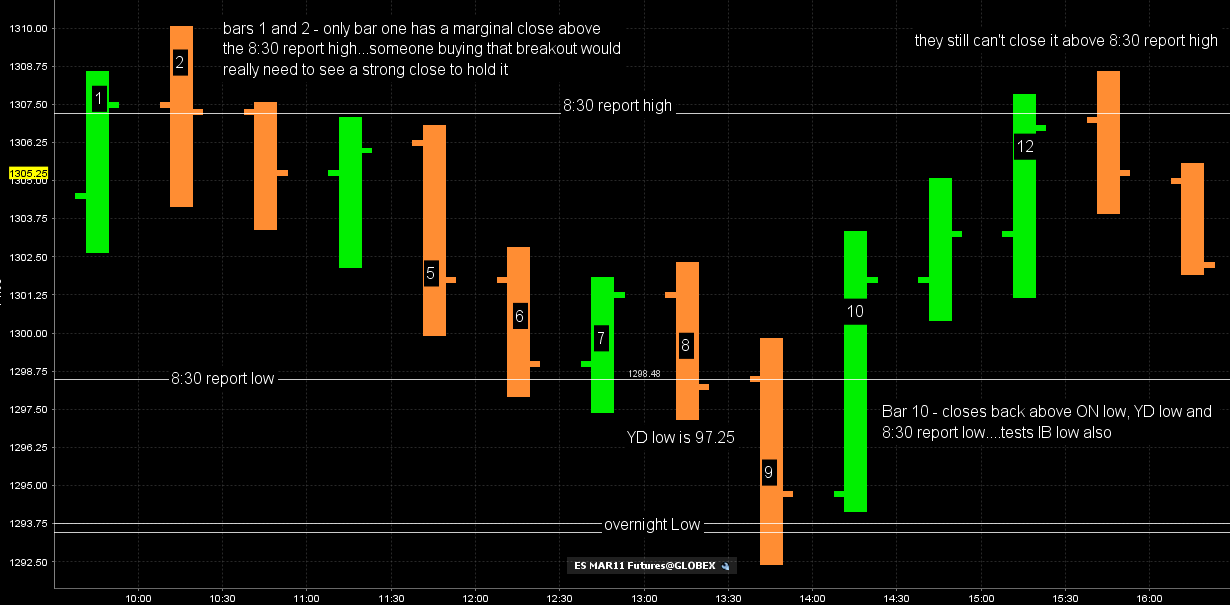
This idea for these lines is "stolen" from the work of one of my trading idols - Dr. Brett....he is aware of the reaction points that are generated from the volume that comes in from the 8:30 EST reports as well as the overall nightime high and low....this makes sense as volume picks up from these reports too. So on this chart I have lines that formed after the 8:30 reports came in up to the 9:30 open.
This chart is busy but labelled and you can see the market struggle to trade and close beyond these key points.
two ideas you will notice in general from the close concepts...
1) They will suck in breakout traders with a good close and then reverse the trade quite often...leading to good moves in the opposite direction
2) Reversal bars that recapture multiple key levels lead to good trades - see bar 10 on the chart and how many key levels it closed above
Click image for original size
Just having up the 5IB levels is a help as to direction, so no, these 30 Min Closes certainly aren't garbage.
It's another indicator of directional strength at the very least, and even could become a trading method for those with "healthy" trading accts.
It's another indicator of directional strength at the very least, and even could become a trading method for those with "healthy" trading accts.
Emini Day Trading /
Daily Notes /
Forecast /
Economic Events /
Search /
Terms and Conditions /
Disclaimer /
Books /
Online Books /
Site Map /
Contact /
Privacy Policy /
Links /
About /
Day Trading Forum /
Investment Calculators /
Pivot Point Calculator /
Market Profile Generator /
Fibonacci Calculator /
Mailing List /
Advertise Here /
Articles /
Financial Terms /
Brokers /
Software /
Holidays /
Stock Split Calendar /
Mortgage Calculator /
Donate
Copyright © 2004-2023, MyPivots. All rights reserved.
Copyright © 2004-2023, MyPivots. All rights reserved.