ES Short Term Trading 2-11-11
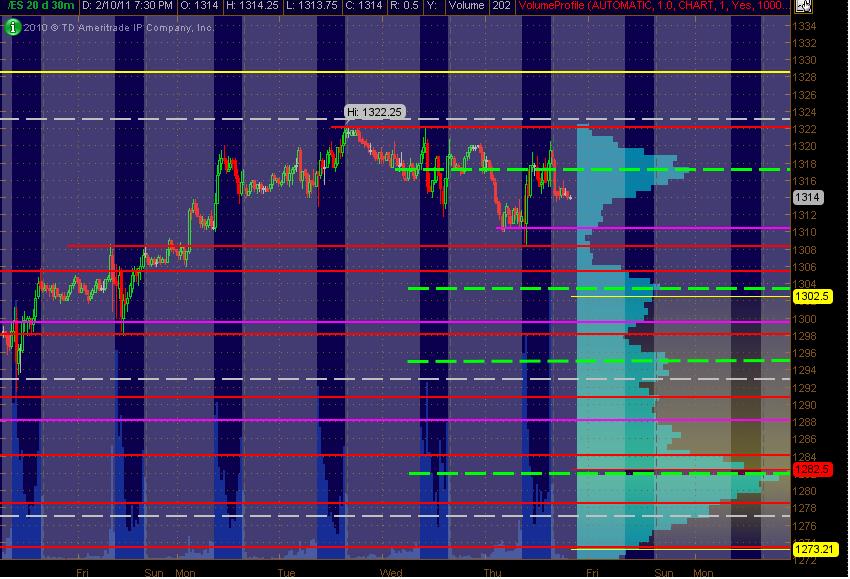
Here's my ES 30min chart with 20 days of Volume Profile vertically displayed on the right side of the chart. The Green Dashed lines are simply the HVN prices. The PASR levels are the Red lines as potentially significant with the Magenta lines as potentially semi-significant. The Yellow line above price is a multi-fib cluster area fwiw. [the grey areas are the "overnight" session, not RTH] This is simply a MAP for going into Friday's trading. Hope it's helpful!
MM
Click image for original size
MM
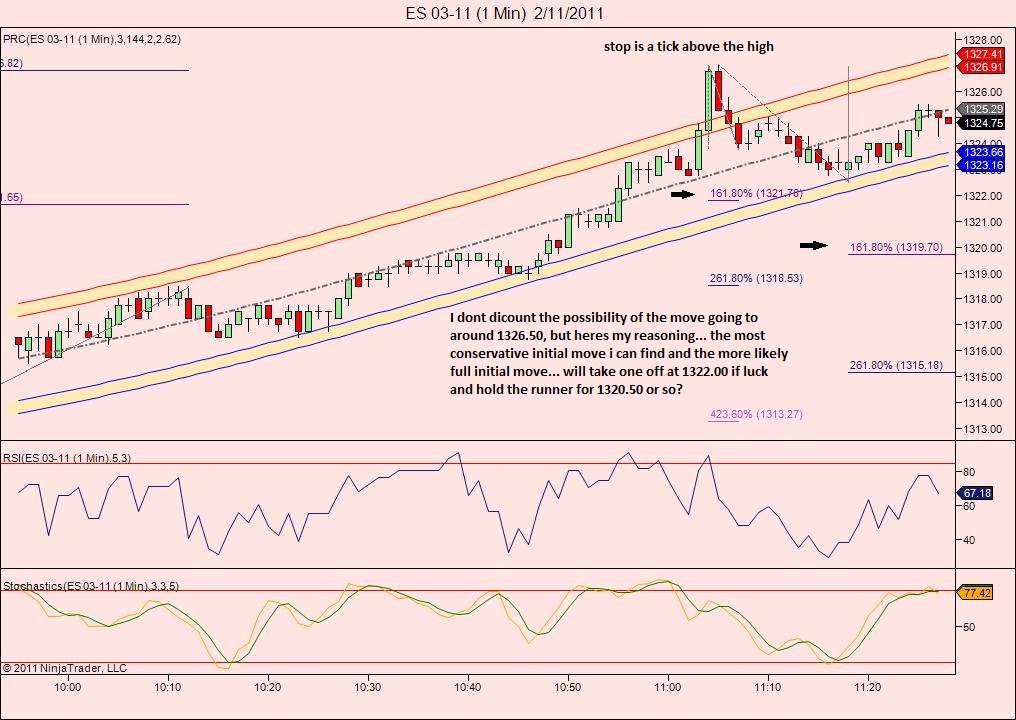
well i still think 1321.75 at a bare bones minimum will be seen,(gotta trust your work!) but im going to unload both at 22 instead of holding a runner!... i need to get back in the black!
boy, i m going to lower my stop to 1326.00 just in case...
my 'uncle point is around 1324.50,so im lowering my stop to breakeven...1325.25, Lord knows they gave me a million chances to get out with a nice profit, but im sure as hell not going to lose money on this attempt!
Originally posted by koolblue"well i still think 1321.75 at a bare bones minimum will be seen,(gotta trust your work!) but im going to unload both at 22 instead of holding a runner!... i need to get back in the black!".. Note to newbies.. the above is the most important lesson i could ever teach anyone!
Click image for original size
wow, im still frazzled from that last trade... but anyway, look for a rebound here(1323.50?) and then resumption to the 1319.75 target?
Man, i called that perfectly , had to sweat for a freakin lifetime , stood strong,trusting my work(which anyone can do),agaist the opinions of most, i suspect, and ended up with a bingo on the bare minimum,taking a total of 6.5 handles there. And not one freakin vote!...You guys suck! (just kidding..kind of)
I shorted 25 again...we'll see if we can get some rotation back...not adding if new highs come
trying to get 22.50 again...that is weekly composite high...leading into today....
this is gonna get interesting now as the trend traders want new highs...they bought on the 50% retrace which was also Yesterdays RTH high...
I'm watching to see if we can get new 30 minute CLOSING highs on the day.....I won't like that!!
I'm watching to see if we can get new 30 minute CLOSING highs on the day.....I won't like that!!
I know that I'm in the minority here because I trade using visual S/R only, no MP, no Fibs, Market Delta... but does the retest and bounce off 1320.50 surprise anyone?
It was a proven resistance line 4 times and would be expected to become support. What am I missing.
Enjoy reading all the posts and charts even if I can't process it fast enough to react.
Good luck to all.
It was a proven resistance line 4 times and would be expected to become support. What am I missing.
Enjoy reading all the posts and charts even if I can't process it fast enough to react.
Good luck to all.
yes Lorn but the context of the day isn't there to take the fade
Emini Day Trading /
Daily Notes /
Forecast /
Economic Events /
Search /
Terms and Conditions /
Disclaimer /
Books /
Online Books /
Site Map /
Contact /
Privacy Policy /
Links /
About /
Day Trading Forum /
Investment Calculators /
Pivot Point Calculator /
Market Profile Generator /
Fibonacci Calculator /
Mailing List /
Advertise Here /
Articles /
Financial Terms /
Brokers /
Software /
Holidays /
Stock Split Calendar /
Mortgage Calculator /
Donate
Copyright © 2004-2023, MyPivots. All rights reserved.
Copyright © 2004-2023, MyPivots. All rights reserved.