ES Short Term Trading 02-18-2011
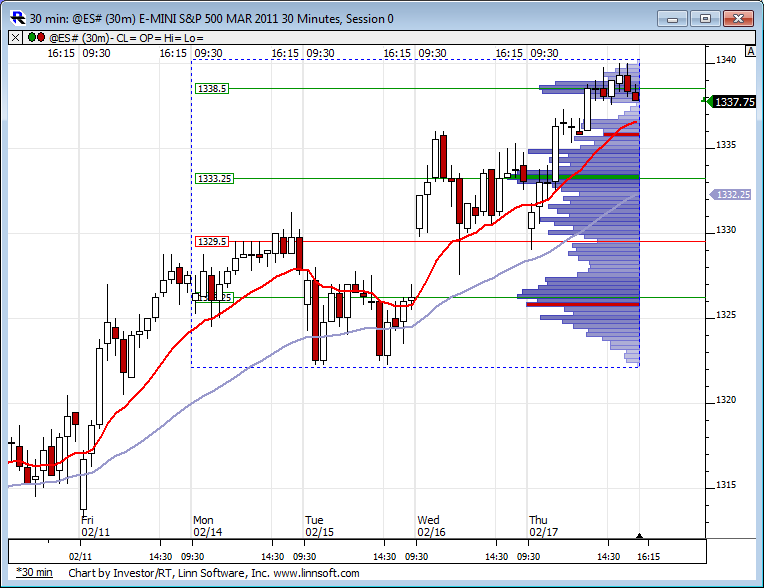
Weekly RTH profile leading into Friday. I'll note the gap from Wednesday was never filled.
Click image for original size
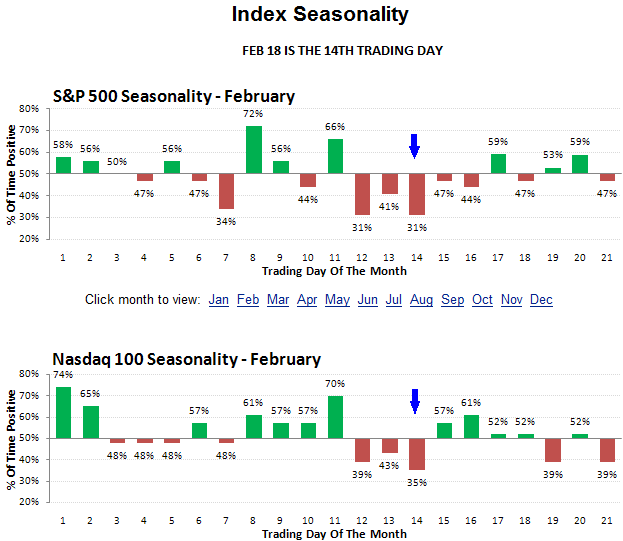
According to Stock Trader's Almanac, day before Presidents Day weekend, SPX down 16 of last 19 and February Expiration Day, Dow down 7 of last 11. And remember the seasonality chart...
Click image for original size
And fwiw, from palisades...Daily forecast for the S&P500 and Nasdaq 100 indexes:
Forecast Made: Forecast For: Direction
February 17, 2011 February 18, 2011 flat to lower
(Remember to reload your screen if old date appears.)
Probability for next day:
Up Probability Average amount (up) Down Probability Average amount (down)
S&P 27% .37% 73% -.36%
NDX 36% .33% 64% -.35%
Forecast Made: Forecast For: Direction
February 17, 2011 February 18, 2011 flat to lower
(Remember to reload your screen if old date appears.)
Probability for next day:
Up Probability Average amount (up) Down Probability Average amount (down)
S&P 27% .37% 73% -.36%
NDX 36% .33% 64% -.35%
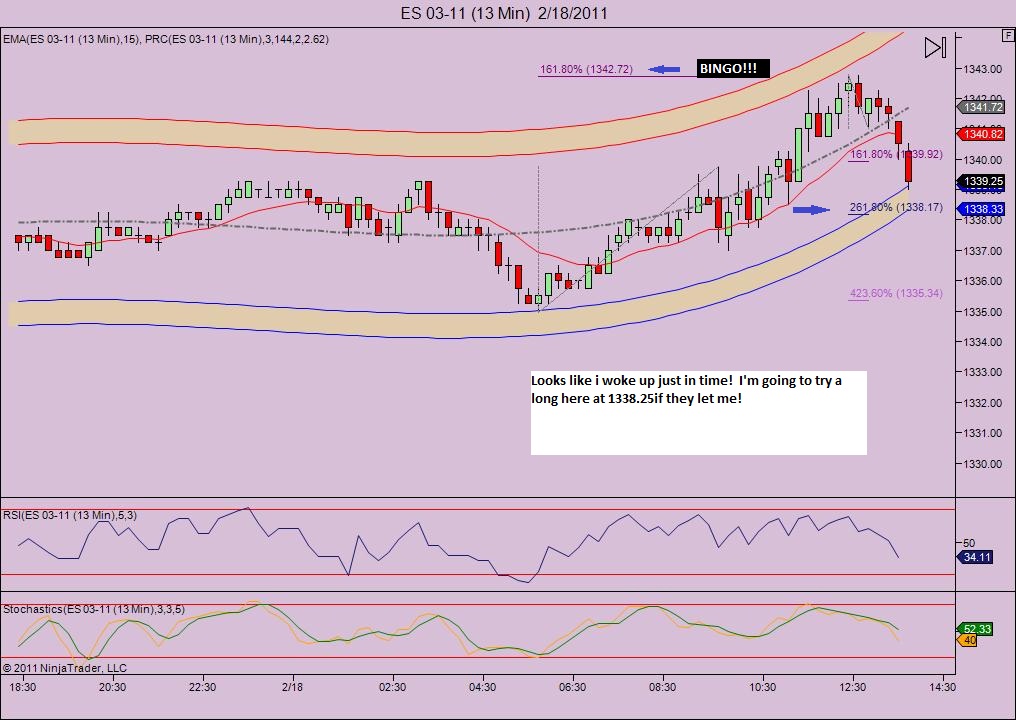
Click image for original size
Sure wish i would have waited for 1339! or even 1341.50,anyway 1339.75 is where my stop is...ugh!
I should point out, as it stands right now, the above chart showing the down projections is still active untill 1340.00 is touched or exceeded... which seems likely of course.
projections still alive, but im not..stopped 1339.75...loss of 2.25 on 2 es, down 4.5 on the day ugh!
buying 1338.25
Click image for original size
AHHH..perfect!..long a couple at 1338.25..will take one off at 1340.00 and hold the runner
one off at 1340..plus 1.75 there (now only down 2.75 on the day).. Holding the runner, still studying the charts to see where to exit the other...
Originally posted by koolblueGod , did i second guess myself or what!! Getting too late for me, hope everyone has an enjoyable weekend and holiday!
ALRIGHT ,BE THAT WAY ...Out the runner at 1337.75.. i'll go long 2 again at 1336 and change!
Emini Day Trading /
Daily Notes /
Forecast /
Economic Events /
Search /
Terms and Conditions /
Disclaimer /
Books /
Online Books /
Site Map /
Contact /
Privacy Policy /
Links /
About /
Day Trading Forum /
Investment Calculators /
Pivot Point Calculator /
Market Profile Generator /
Fibonacci Calculator /
Mailing List /
Advertise Here /
Articles /
Financial Terms /
Brokers /
Software /
Holidays /
Stock Split Calendar /
Mortgage Calculator /
Donate
Copyright © 2004-2023, MyPivots. All rights reserved.
Copyright © 2004-2023, MyPivots. All rights reserved.