ES weekend preview 2-20-11
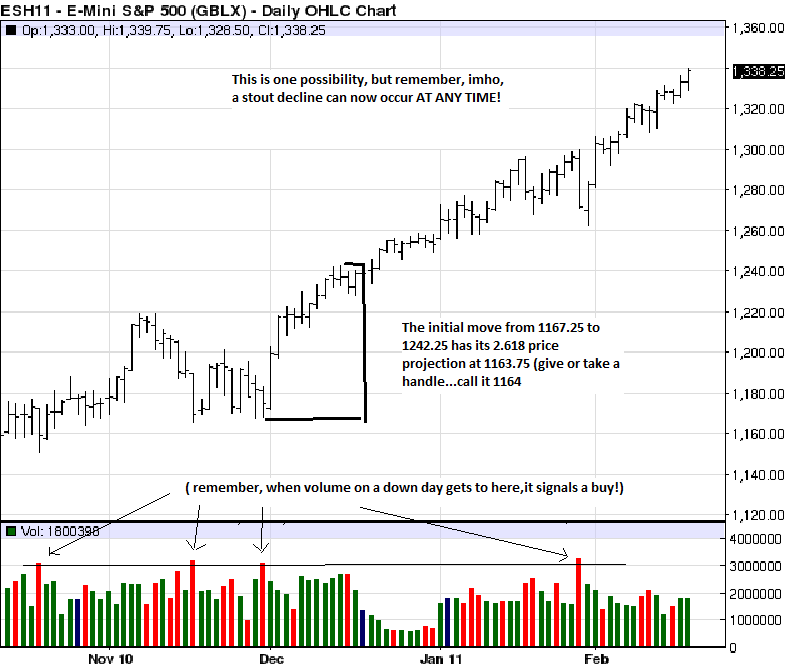
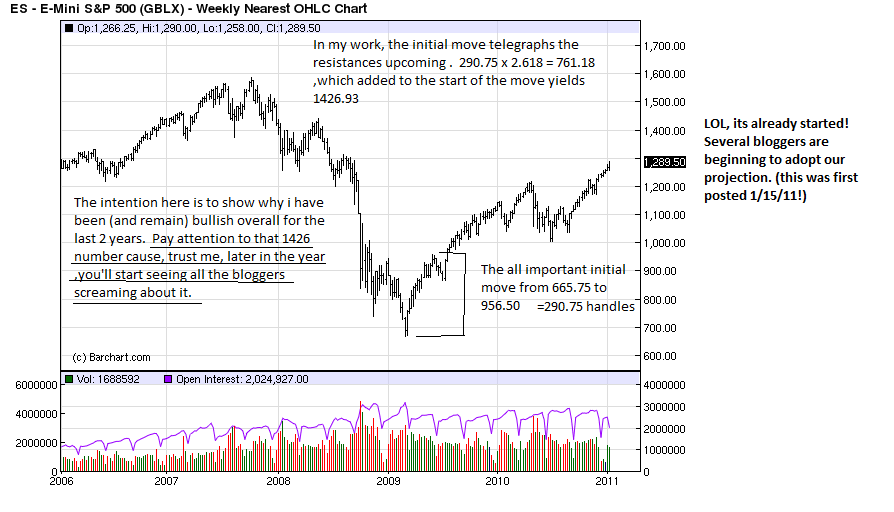
Just a brief review this weekend. Long term, the market signalled it wants 1426 this year,at a minimum. This projection was given off of the bear low of 665.75 and initial move up to 956.50.(long ago the move above 1136.25,the 1.618 is what turned me longer term bullish(for now) ,untill the 2.618 at 1426-7.)On the intermediate term, i was looking for a decent pullback at 1302.50. Then again at 1333-1336.50. Both areas gave small pullbacks only as the rally extended against increasingly negative technicals. This forced me to look again at intermediate charts. I showed last weekend how this leg of the advance should attain at least 1357.25 or higher before a meaningful decline.Im thinking that 1364 might be the area...
Click image for original size
Besides the fact that sentiment is flat to negative this week, sentimentrader reports that the day after Presidents day (Tues) has been positive only 36% of the time. They also note that the only 3 times the s&p cash had a close higher than the open ..."That's an incredible streak that has been seen only 3 other times in the contract's nearly 30-year history.
The others were 1/8/92, 8/30/93 and 9/14/95. Interestingly, each time the futures topped out during the next few days, and lost around 3% maximum during the next three weeks."... So again this week , there are good sentiment and historical reasons to be cautious here.Add to that the fact that the last couple days of the month have been bearish ,at least for the last 7 months or so, and Stock traders almanac reports the Dow has been down the last 9 OF THE LAST 12 times the week after Feb expiration. Of course ,so far, this market has defied most historical considerations. Remember Feb was usually a lousy month! I do note however, that recently the small cap leaders, are beginning to lag! (sp up 1% last week, nas up .9%) . I place a lot of importance on this! So, in summary, a little pullback can come at anytime now ,but a decent one is probably , a ways off yet!
The others were 1/8/92, 8/30/93 and 9/14/95. Interestingly, each time the futures topped out during the next few days, and lost around 3% maximum during the next three weeks."... So again this week , there are good sentiment and historical reasons to be cautious here.Add to that the fact that the last couple days of the month have been bearish ,at least for the last 7 months or so, and Stock traders almanac reports the Dow has been down the last 9 OF THE LAST 12 times the week after Feb expiration. Of course ,so far, this market has defied most historical considerations. Remember Feb was usually a lousy month! I do note however, that recently the small cap leaders, are beginning to lag! (sp up 1% last week, nas up .9%) . I place a lot of importance on this! So, in summary, a little pullback can come at anytime now ,but a decent one is probably , a ways off yet!
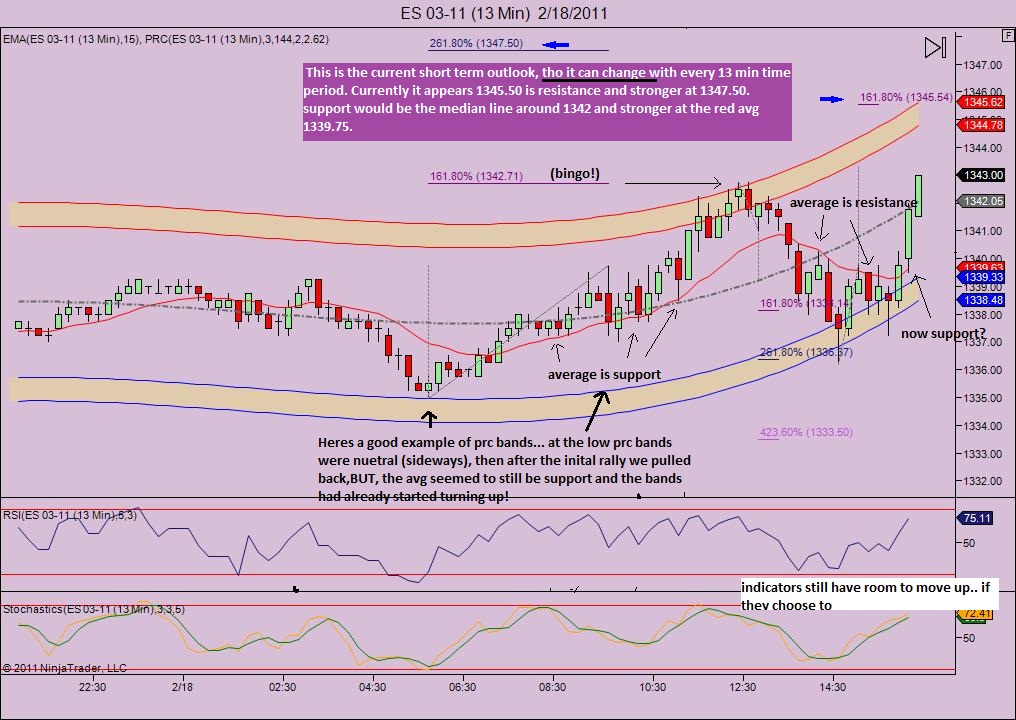
quick look at the intraday status:
Click image for original size
Note that from the 16th on there is a distict divergence!...
Click image for original size
...Click image for original size
cycles are basically down thru the end of the month now...courtesy Helge:
Click image for original size
Click image for original size
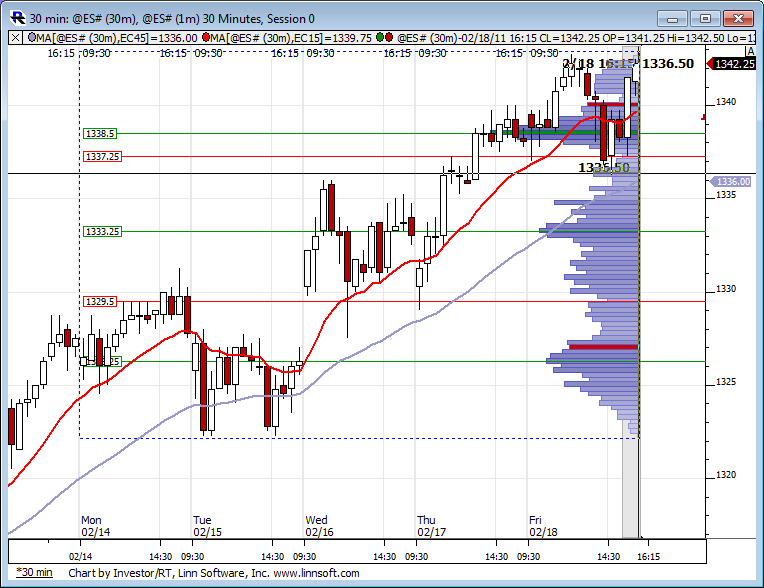
Here is last weeks RTH profile. Interesting to see prices pause here in holiday trading at the HVN (green) of 1338.50 which just so happens to be the 2.618 projection down off Fridays peak using the 30 min time frame.
Click image for original size
great chart, as always, Lorn!
Lorn,
I missed your last point. Re:
Did you mean that the 1338.50 mark was at a 2.618 DOWN from Friday's peak or that 1338.50 was UP from some earlier projection? Thanks for the Chart.
I missed your last point. Re:
Here is last weeks RTH profile. Interesting to see prices pause here in holiday trading at the HVN (green) of 1338.50 which just so happens to be the 2.618 projection down off Fridays peak using the 30 min time frame.
Did you mean that the 1338.50 mark was at a 2.618 DOWN from Friday's peak or that 1338.50 was UP from some earlier projection? Thanks for the Chart.
Hi Arch,
I meant DOWN from the peak. Here is a chart with green arrow at the point I was referring to last night.
I meant DOWN from the peak. Here is a chart with green arrow at the point I was referring to last night.
Click image for original size
Originally posted by arch1
Lorn,
I missed your last point. Re:
Here is last weeks RTH profile. Interesting to see prices pause here in holiday trading at the HVN (green) of 1338.50 which just so happens to be the 2.618 projection down off Fridays peak using the 30 min time frame.
Did you mean that the 1338.50 mark was at a 2.618 DOWN from Friday's peak or that 1338.50 was UP from some earlier projection? Thanks for the Chart.
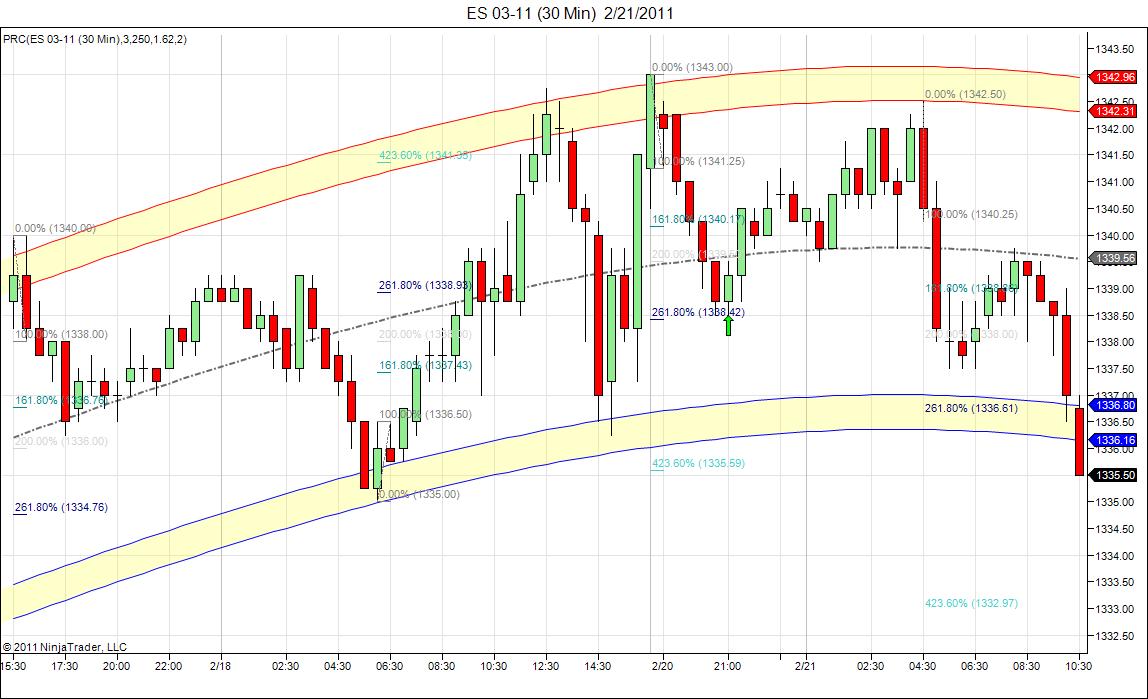
taking 1342.50 (the secondary high as the primary high proj was already fullfilled) to 1387.50 gives a 2.618 down projection of 1329.50...which is a buy zone imho!
wonder if the slide in the ES had anything to do with oil up 6 bucks?
Emini Day Trading /
Daily Notes /
Forecast /
Economic Events /
Search /
Terms and Conditions /
Disclaimer /
Books /
Online Books /
Site Map /
Contact /
Privacy Policy /
Links /
About /
Day Trading Forum /
Investment Calculators /
Pivot Point Calculator /
Market Profile Generator /
Fibonacci Calculator /
Mailing List /
Advertise Here /
Articles /
Financial Terms /
Brokers /
Software /
Holidays /
Stock Split Calendar /
Mortgage Calculator /
Donate
Copyright © 2004-2023, MyPivots. All rights reserved.
Copyright © 2004-2023, MyPivots. All rights reserved.