Weekend preview 3-13-11
Once again we find ourselves at expiration week (generally has a bullish bias) and bouncing off of important support.for the past month ,ive laid out a very basic expected scenerio: a much needed pullback, which would be a great buying opportunity, as prices will soo exceed the recent rally highs(1337.75 basis June es). This view is supported by several quantitative models, most recently this one from sentimentrader:"S&P has finally closed below its 50-day average. Though looking at all other instances since 1928, such an ending didn't lead to any market peaks of significance, with the S&P taking a median of 19 days to hit a new 52-week high." that would be new highs by the 2nd week of April! in the short term there are many reasons this rebound may carry just a bit further... this (again from sentimentrader after last Thurs action!)
Risk Level: 4
"Summary: Equities have continued to crack after seeing short-term overbought conditions earlier this week, and now several major indexes are below obvious support levels and with a pattern of lower highs and lowers lows for the first time since last summer.
The decline triggered a few extremes worth mentioning. Since September, every time the Equity-only Put/Call Ratio surged above 0.70, the S&P 500 rallied over the next several days. Out of the 8 occurrences, not once did the S&P lose any more than -1.1% at its worst point during the next three days (the median was only -0.4%).
There was also a big extreme in the ISE Sentiment Index. On the ISE Exchange, only 60 call options were bought for every 100 put options, something we haven't seen since last May the day after the flash crash. Since 2003, a reading this low has either marked a bottom or been within a few days of one (though a few times those "few days" involved some scary short-term selling pressure).
It's a similar situation for the Rydex Beta Chase Index,
which also went to its most-extreme reading since May of last year. As of yesterday, traders in the Rydex mutual fund family were 2.5 times more likely to trade a "safe" fund than a "risky" one. When that indicator reached this low of a level during bull market conditions, the S&P 500 rebounded over the next 2 sessions 72% of the time."... All point out the rally of a few days that now appears to be under way.. It could be short lived however, as sentiment charts indicate:
Click image for original size
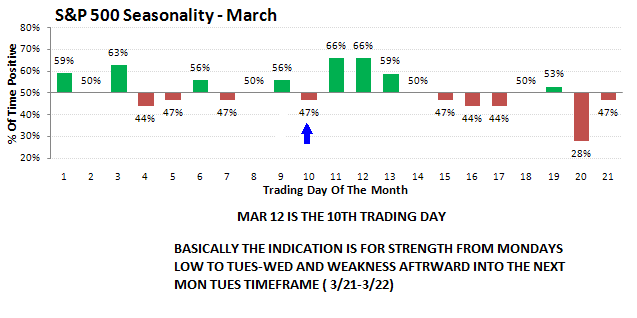
Did anyone notice on all the down days the nas was leading the s&p cash?(bearish). And look at the rebound day friday...the s&p cash was up 0.71% but the nas was lagging at 0.54%! This does not argue for a straight shot up to new highs now ,imho!
Click image for original size
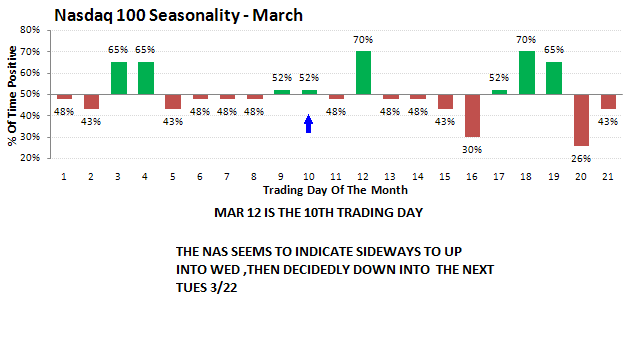
So in summary: After a dip Monday, id be expecting strength into probably Wed, after which the decline may continue....
Click image for original size
oh yeah, i almost forgot!... for my market profile friends!...enjoy!..http://clicks.aweber.com/y/ct/?l=4uhou&m=1eutus028KuSqP&b=_IyF5VnW1XTiGn60XjKYzQ
And here is an interesting study from Bespoke, reinforcing my view that higher prices are a month away!...http://www.bespokepremium.com/members/wp-content/uploads/2011/03/longest-streaks-above-50-dma.pdf
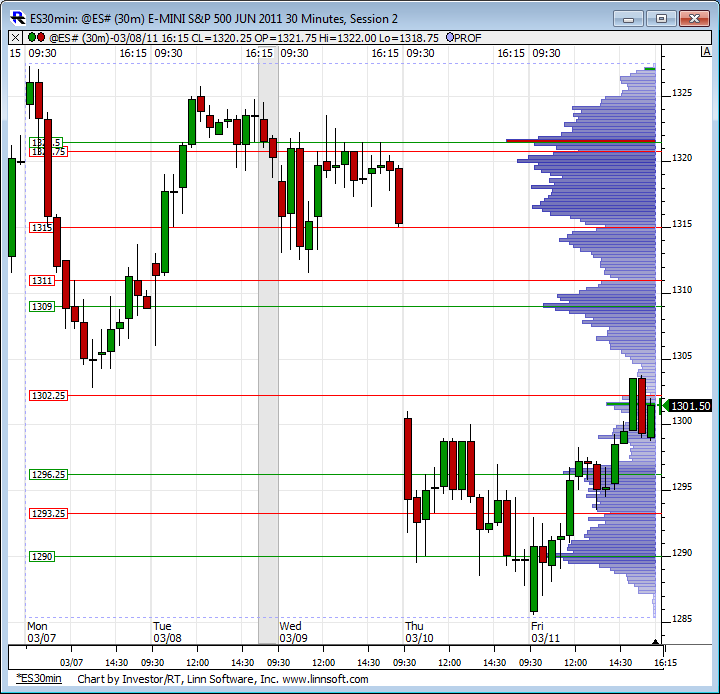
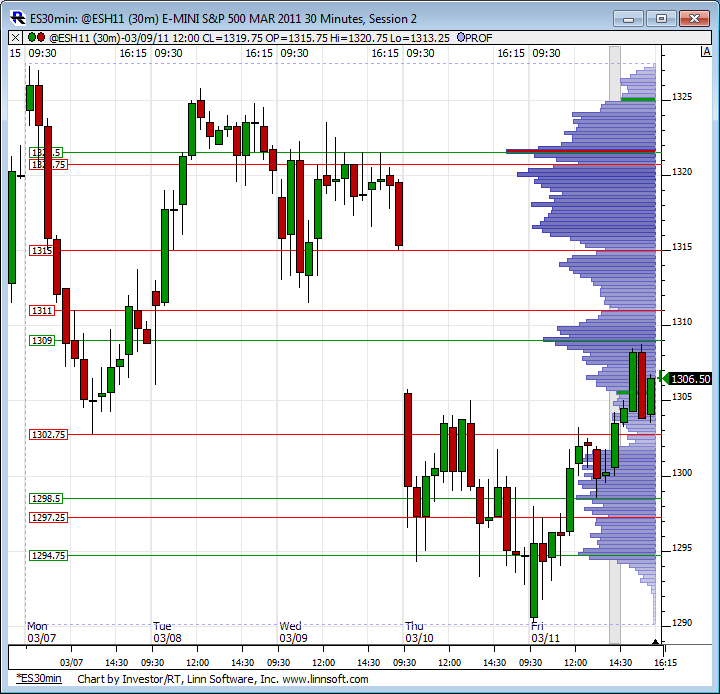
Here is last weeks RTH profile on a 30 min chart. First one is the new June contract. Second one is the March contract for some contrast as far as where the volume is falling in relation to the price pivots. June contract only barley touched the low of Monday while March went higher. May be a function of positions being unwound in the March and put on in the June so my question is are they short positions?
That is one big unfilled gap. Is this a breakaway gap to the downside? Time will tell.
That is one big unfilled gap. Is this a breakaway gap to the downside? Time will tell.
Click image for original size
Click image for original size
One more tid-bit for longer term players... here are the square of nine numbers that may be relevant over the next 2-3 months. generally, the first time one is hit, its good for a short term bounce...the stars indicate prime numbers (thereby even more important)
1225
1243
1261
1279*
1297*
1315
1333
1351
1369
1388
1407
1426
1225
1243
1261
1279*
1297*
1315
1333
1351
1369
1388
1407
1426
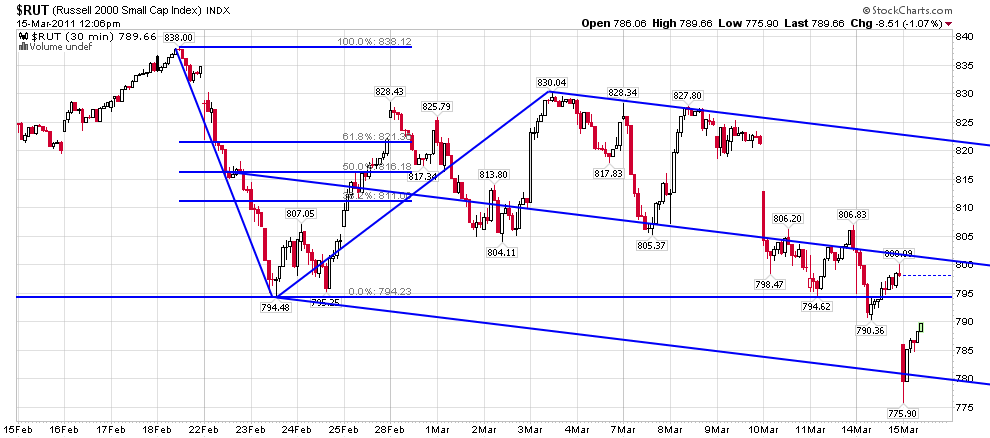
kool i remain on crash alert as i stated in last weeks comment.i would point to the bradley model which you pointed to last week but did not include this week .it called for an important turn mid feb then a move of large amplitude... it is well known that it often inverts and that an expected upmove becomes down... if a crash occurs, this chart gives a map for expected move.
Click image for original size
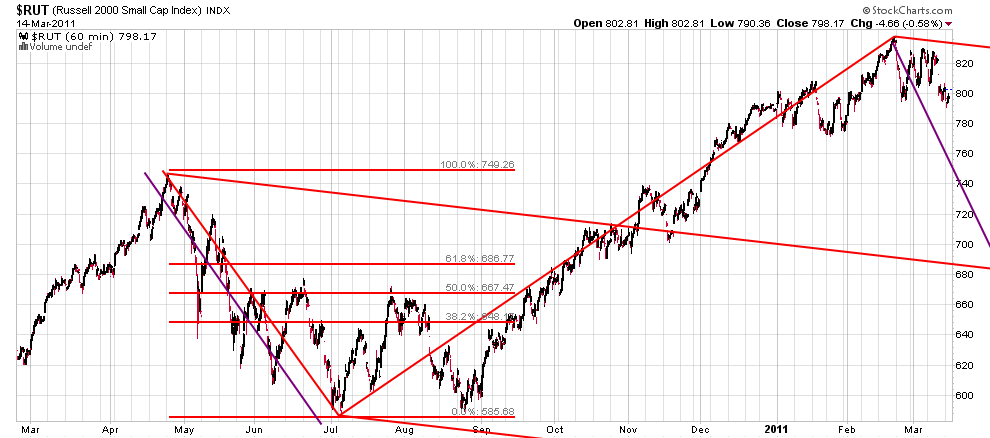
the inability of price to close below this smaller set say there is a good chance a crash will be avoided...
Click image for original size
Emini Day Trading /
Daily Notes /
Forecast /
Economic Events /
Search /
Terms and Conditions /
Disclaimer /
Books /
Online Books /
Site Map /
Contact /
Privacy Policy /
Links /
About /
Day Trading Forum /
Investment Calculators /
Pivot Point Calculator /
Market Profile Generator /
Fibonacci Calculator /
Mailing List /
Advertise Here /
Articles /
Financial Terms /
Brokers /
Software /
Holidays /
Stock Split Calendar /
Mortgage Calculator /
Donate
Copyright © 2004-2023, MyPivots. All rights reserved.
Copyright © 2004-2023, MyPivots. All rights reserved.