ES Weekend preview 3-27-11
This will likely be the last weekend preview, since most of us are very short term players, im just not sure how useful it is! Anyway, here's what im looking at now, with an emphasis on the shorter term, but be aware that so much can change with Sun nights globex trading, that you have to take it (especially short term proj. numbers) with a grain of salt!....first , a quick look at next months seasonals (historically,the 3rd best month of the year,after Nov and Dec!)....This chart has both the % of time pos. and avg return on it!...
Click image for original size
and heres a look at more recent data... from 1990 to present..(remember both charts are trading days not calendar days, (ie: day#2 is April 4,not April 2nd!)...Click image for original size

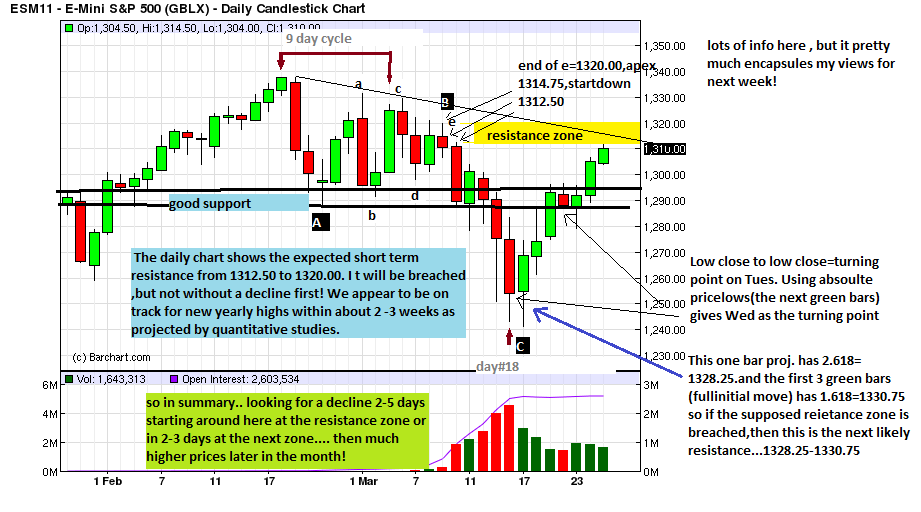
More to the point , heres what im looking at on a daily basis...
Click image for original size
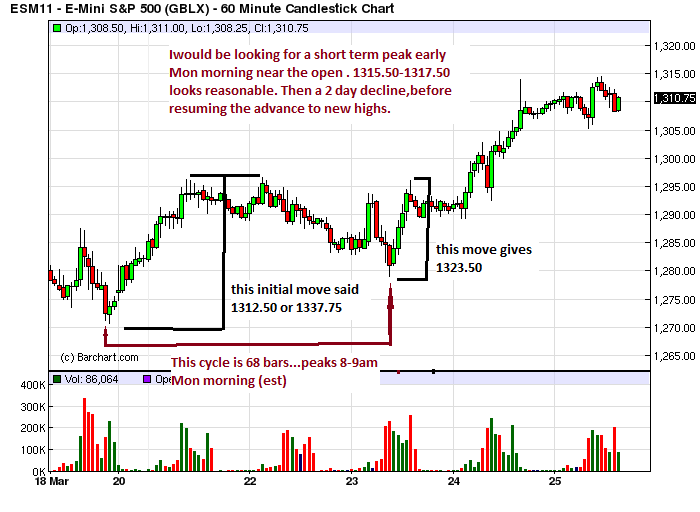
This is a 'wild guess' just for fun,based on the hourly chart...
Click image for original size
and here are my charts as of the close Friday, mainly so you can see the bands ( remember Sun night can change things dramatically, especially on the shorter term charts!)... Click image for original size
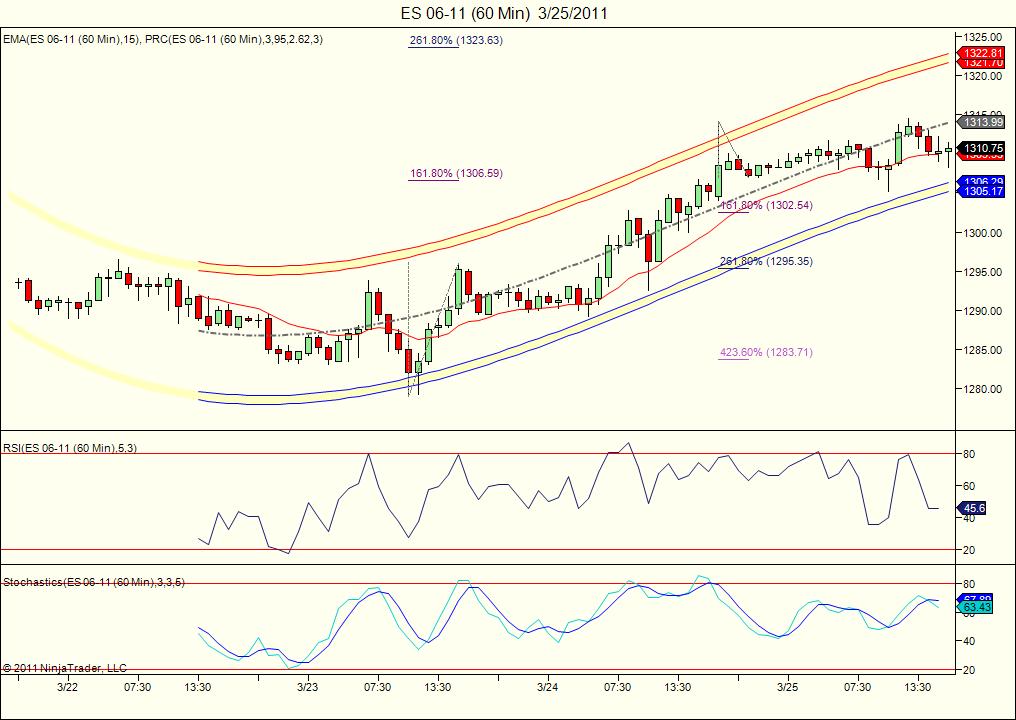
Click image for original size

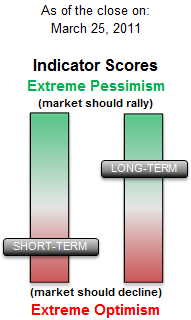
AND FINALLY: regarding the longer term, i believe a significant intermediate term bottom is either in or will be on the next significant decline(statiscally they take 2-18 days to form) before a resumption of the uptrend to 1426 minimum,possibly by the end of June? One is from Price Headly and the other from sentimentrader....both seem to reinforce my opinion/
Click image for original size
Click image for original size
so with that ,i sign off! It has been my pleasure to post these charts and opinions and hopefully a few weekend previews helped a little!Click image for original size

Kool, Thank you very much for the detailed explanation with charts. If oil price do not decline next week, then S&P may struggle to go up. Volume is weak and NASDAQ is also weak. This week will be crucial for testing the resistance. My assumption is that profit booking may take place this week before resuming uptrend.
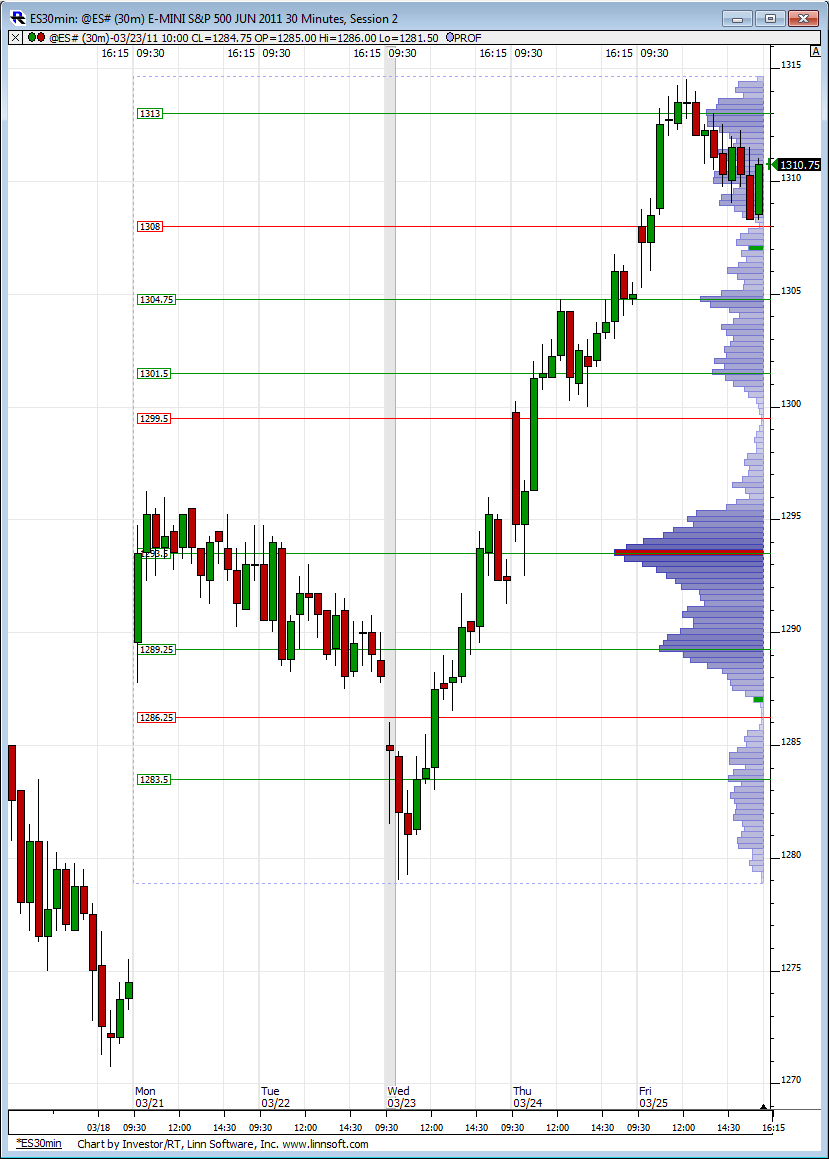
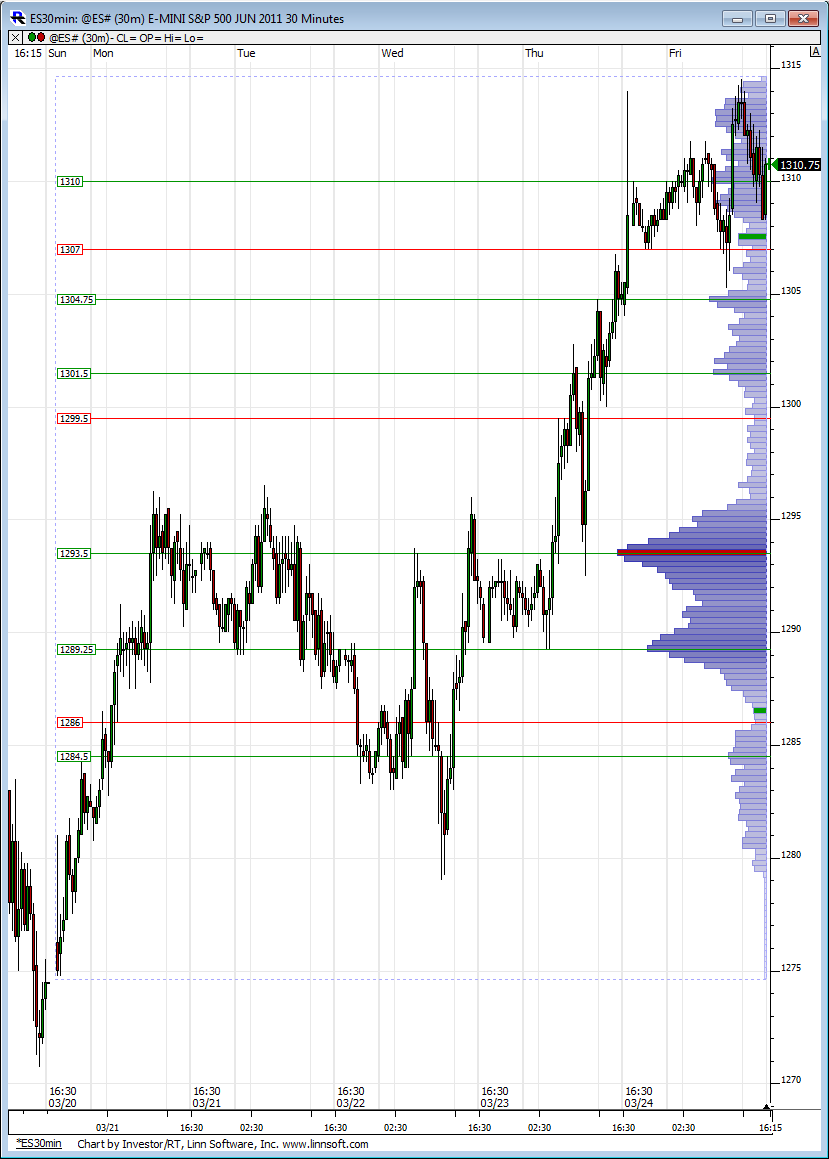
Here are two charts to help with prep work. First one is the RTH profile from last week and the second one is the full globex profile for last week.
Click image for original size
Click image for original size
Thanks Kool and Lorn
Emini Day Trading /
Daily Notes /
Forecast /
Economic Events /
Search /
Terms and Conditions /
Disclaimer /
Books /
Online Books /
Site Map /
Contact /
Privacy Policy /
Links /
About /
Day Trading Forum /
Investment Calculators /
Pivot Point Calculator /
Market Profile Generator /
Fibonacci Calculator /
Mailing List /
Advertise Here /
Articles /
Financial Terms /
Brokers /
Software /
Holidays /
Stock Split Calendar /
Mortgage Calculator /
Donate
Copyright © 2004-2023, MyPivots. All rights reserved.
Copyright © 2004-2023, MyPivots. All rights reserved.