ES 3-31-2011
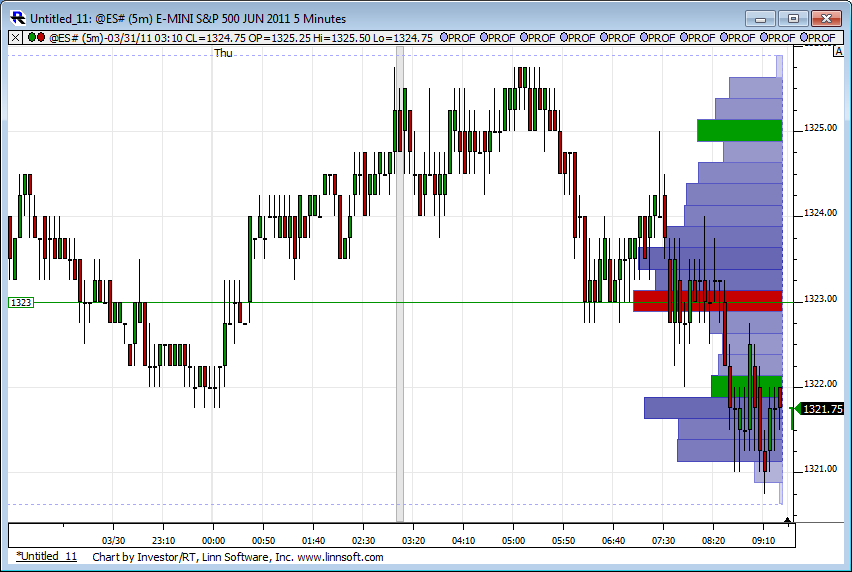
see the midline on that chart? 1323.50.. thats also the vwap on the 13 min chart.. a one min proj off of 1320.50 shows potential for 1324.50, but i still think we edge lower in time to the 1319 and change area... this boring ,plodding action (whether up,or down) was indicated by the gap today in side yesterdays range..simple historical odds! Ive been mentioning this kind of stuff lately cause of a past interest by many here on how to identify a 'trend day'. im trying to show you how you can right when the day begins!
Thanks Koolblue, your postings are very helpful and appreciated.
Originally posted by TravelinTraderThx, thats what im here for!
Thanks Koolblue, your postings are very helpful and appreciated.
Click image for original size
so we have a neutral day...trade on both sides of the IB and we just tested the 24.50 again....The middle of the range becomes important and a terrible place to initiate IMHO...best to fade still and use middle as a targte...
such small range but the concept is important
such small range but the concept is important
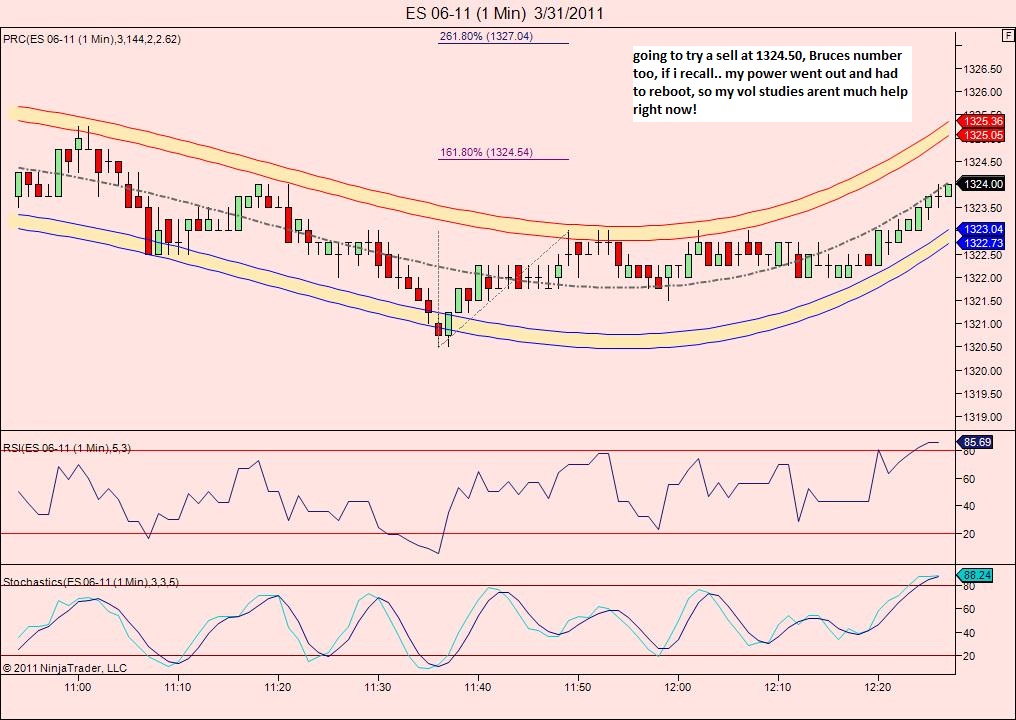
ok..short from 1324.50..here how i play it... one min chart shows a little initial move(so far ,anyway) from 1324.75 to 1323.50...1.618=1322.68, 2.618= 1321.39..so even tho im hoping for 1319and change later,i'll take one off at 1323.25 and hold the runner for at least 1321.75 maybe lower...
wow..strong buying here ..time to exit!
something to think abaout........the sellers of the 24.50 will be trying a third time now for the sells...they have been rewarded twice already....but what happens if/when they realize that they ARE NOT gonna be rewarded and start exiting....it's then when you see those ugly POP ups......in this volatility it wouldn't be as dramatic.....but we do know that triples and a gap exists up at the 26.25 - 26.75 area.....
just a thought....I'm flat and staying that way..
all those sellers exiting.....can cause a price spike higher as the longs take over....just a thought...I really have no real clue that it will happen up here
just a thought....I'm flat and staying that way..
all those sellers exiting.....can cause a price spike higher as the longs take over....just a thought...I really have no real clue that it will happen up here
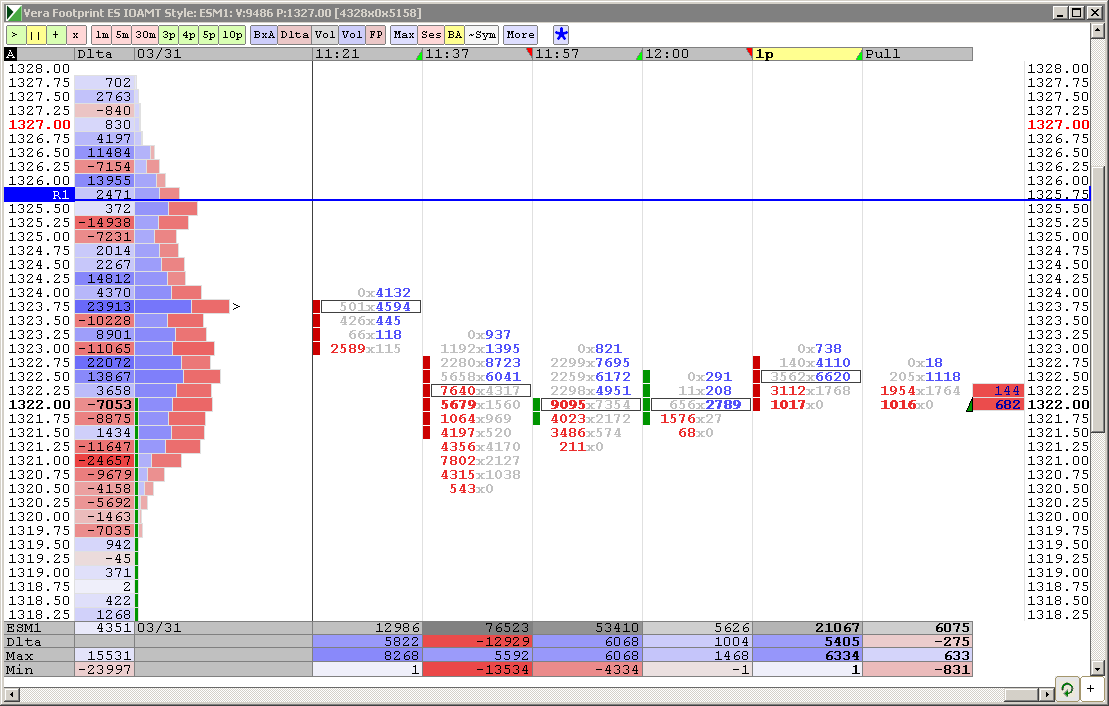
30-min traders see a 2-bottom in an uptrend, but daily charts are at Resistance. I am going to wait for a probe by either buyers or sellers. My chart shows a rotation around the VWAP, which is at 1323.25 now. Doing nothing.
Originally posted by koolblue
somehow,pal, we really need to consolidate all of our 'teaching' dialogues... and other folks also. P.T.'s had a few , Paul,Lorns,etc and put them all in one easy place to find! Im pretty good at finding stuff and would be willing to spend a weekend doing it, if D.T. agrees, but i fear if we dont, in a couple months,or a year it'll be hard to find(in effect lost!). Another good example is Charter Joes mini ib method... I feel it would be invaluable to newer traders!... thx again!
I can certainly help with that. I wonder if the dictionary would be the right place to put it? The site is setup so that I can auto-link certain words to the dictionary - as most of you already know. So if we came up with names for the strategies, setups, methods and techniques then we could add each one of them to the dictionary as a distinct item and then auto-link them from here. For example, we could call one "Bruce's Air" and that would link to something like this:
http://www.mypivots.com/dictionary/definition/407/air-pocket
which was taken from something that Bruce wrote.
It seems to be the most obvious place to collect the information. Also the dictionary also has a fast lookup search bar.
If you want to experiment with this idea try and add one from here:
http://www.mypivots.com/dictionary/create
and I'll help clean it up and then add the auto-link words.
Good idea and great stuff guys!
Emini Day Trading /
Daily Notes /
Forecast /
Economic Events /
Search /
Terms and Conditions /
Disclaimer /
Books /
Online Books /
Site Map /
Contact /
Privacy Policy /
Links /
About /
Day Trading Forum /
Investment Calculators /
Pivot Point Calculator /
Market Profile Generator /
Fibonacci Calculator /
Mailing List /
Advertise Here /
Articles /
Financial Terms /
Brokers /
Software /
Holidays /
Stock Split Calendar /
Mortgage Calculator /
Donate
Copyright © 2004-2023, MyPivots. All rights reserved.
Copyright © 2004-2023, MyPivots. All rights reserved.