ES 4-4-2011
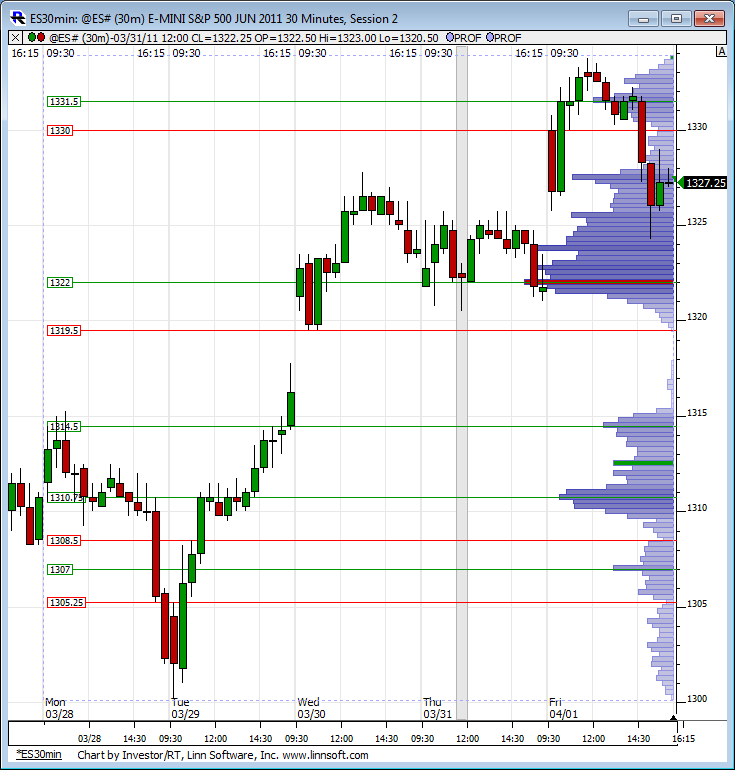
Getting the week started off here is a look at last weeks RTH profile.
Obvious zone on this chart is the gap in the middle with virtually zero volume.
Obvious zone on this chart is the gap in the middle with virtually zero volume.
Click image for original size
i will try a buy(one only...protecting profits at 1324.75
No fill..sigh, and this time im not chasing... watching...
One more pice of evidence for a tradable bounce here(for me anyway) is the clear 7 waves down on the 5 min chart!..Long time posters know i look for that (as opposed to 5 Elliot waves).Selling does appear to have dried up.. right at the 1324.75 projection...at least so far...going to get some rest..Good trading all!!!
Hope this observation helps, If someone has a TPO chart you can pull it up on a 5 min chart, i show a VPOC of 1333.75 from 2/17 and bruce's volume spike of 1324.50 from 3/31 seems to be the current range. there's some other key levels and once i am near my charts i can post them for tomorrow if they still hold water.
starting to really like this volume thing.. thanks again bruce, your explanation were awesome!
starting to really like this volume thing.. thanks again bruce, your explanation were awesome!
glad to be of help......I had a video from Friday but the sound was too low....I'll have to redo that when I can fix the sound...
Originally posted by optimusprime
Hope this observation helps, If someone has a TPO chart you can pull it up on a 5 min chart, i show a VPOC of 1333.75 from 2/17 and bruce's volume spike of 1324.50 from 3/31 seems to be the current range. there's some other key levels and once i am near my charts i can post them for tomorrow if they still hold water.
starting to really like this volume thing.. thanks again bruce, your explanation were awesome!
this is for all the footprint folks...
How do we really know that big volume hitting bids is really selling?
The big volume at 1325 on the bid side made the market rise....
I must be missing something conceptually....I'm usually not this dense...but if I was short how would I know to cover when that big volume hit at 25.....instead of riding for more shorts...
Now the earlier volume spike at 27.50 ( 11:07 a.m)was actually buyers....and the market rose that makes sense..
Needs to be a grid or matrix somewhere....I need a matrix....LOL!!
Bruce,
I don't think you are missing anything conceptually, however there is one important piece perhaps you are not thinking about.
Any volume has two sides to it, right? So yes the big bid volume is telling us sellers are selling however there must be buyers for those sellers...
So if price doesn't fall on big bid volume it represents in my mind at least, plenty of inventory willing to absorb the selling. So, if/when the sellers must cover you get an even faster rising market.
Whether that helps you in your trading only you can answer that.
Originally posted by BruceM
this is for all the footprint folks...
How do we really know that big volume hitting bids is really selling?
The big volume at 1325 on the bid side made the market rise....
I must be missing something conceptually....I'm usually not this dense...but if I was short how would I know to cover when that big volume hit at 25.....instead of riding for more shorts...
Now the earlier volume spike at 27.50 ( 11:07 a.m)was actually buyers....and the market rose that makes sense..
Needs to be a grid or matrix somewhere....I need a matrix....LOL!!
Bruce,
You are actually opening one of the great trading conundrums. That is whether you are looking at a statistical coincidence or an actual truism. Most information points traders use are nothing more than statistical coincidences for which they create explanations. Footprint charts fall into this category.
Truisms are the stuff of true "edges". Most traders run out of time, money or both before they ever figure this out.
Thanks for that reply BeyondMP......I'm determined but I'm not gonna beat my head against the wall in order to to "force" something to work for me. I'm also not concerned of running out of money but it always seems that these footprint ideas look so great after the fact....and this would also apply to my Idol Dr. Brett...so I'm going global in that comment...
We see these great ideas after they are over but nobody shows us specific ideas with the Footprint over time. Pt did some great videos and conceptually they show promise. So I tip my hat to him...I'm also not really asking to be spoon fed the complete answer....the footprint is only one aspect of the total volume picture...we also have foootprints of what the big and small traders are doing. Do we get different results based on time frame or the filter we apply to what we track? I.E. what happens if we filter out the small traders...
So market delta can be very complex and It's amazing that all these folks make so much $$$$ leasing software but nobody has specific rules...I guess they don't want to make us money too easy. I'm not afraid of hard work.
So I'm a bit frustrated by it tonight,,,but it shows me who was more active at my volume spikes...which will help me EVENTUALLY I think but we don't really need it to trade
I mentioned you in a thread this morning BeyondMP but had to delete it as my video had poor sound....but glad to hear your comments and please give us any pointers you feel like sharing...perhaps we will finally get to do our skype idea from months back before my hand surgery...
Originally posted by beyondMP
Originally posted by BruceM
this is for all the footprint folks...
How do we really know that big volume hitting bids is really selling?
The big volume at 1325 on the bid side made the market rise....
I must be missing something conceptually....I'm usually not this dense...but if I was short how would I know to cover when that big volume hit at 25.....instead of riding for more shorts...
Now the earlier volume spike at 27.50 ( 11:07 a.m)was actually buyers....and the market rose that makes sense..
Needs to be a grid or matrix somewhere....I need a matrix....LOL!!
Bruce,
You are actually opening one of the great trading conundrums. That is whether you are looking at a statistical coincidence or an actual truism. Most information points traders use are nothing more than statistical coincidences for which they create explanations. Footprint charts fall into this category.
Truisms are the stuff of true "edges". Most traders run out of time, money or both before they ever figure this out.
Monkey Meat,
WOW, that SOHU was a monster :), made almost $900 in less than 2 hours. That was a great ascending triangle. I had my entry at $91.74, got out with $4.50 profit 200 shares, THANK YOU!
WOW, that SOHU was a monster :), made almost $900 in less than 2 hours. That was a great ascending triangle. I had my entry at $91.74, got out with $4.50 profit 200 shares, THANK YOU!
Originally posted by MonkeyMeat
And for other equity traders out there like this Monkey ... thought I'd post some potential LONG PICKS ... but should be considered only if the overall mkt (ES) is moving up. Looked at 1200+ charts ... and with the market (and lotsa stocks) showing recent hard runs up, and the ES nearing potential signif resistance on the BIGGER time frame ... trade long with caution on these ... if at all.
SOHU
FOSL
PNRA
(the above picks may need a day or few of pullback or consolidation)
BIDU (careful with this minefield, and size accordingly)
DECK
OPEN
HUM
WLP
Energy stocks have been on a rampage showing great setups and follow-thru. Normally don't include any of those since their price has outside factors that can jack with 'em out of the blue and ya end up in sh*! creek in a chicken wire canoe without a paddle. So just a heads up on these three:
HOC
PXD
WLL
As always, hope some find this helpful!
Glad ya nabbed SOHU ... unfolded well. Considering the market was range bound, most of the stock picks held up well with many also reflecting the ES price activity ... but they performed pretty well overall ... with 1 or 2 semi-lemons. Thanks for the feedback; it's nice to hear back that someone's profited from the picks. Good stuff!
Emini Day Trading /
Daily Notes /
Forecast /
Economic Events /
Search /
Terms and Conditions /
Disclaimer /
Books /
Online Books /
Site Map /
Contact /
Privacy Policy /
Links /
About /
Day Trading Forum /
Investment Calculators /
Pivot Point Calculator /
Market Profile Generator /
Fibonacci Calculator /
Mailing List /
Advertise Here /
Articles /
Financial Terms /
Brokers /
Software /
Holidays /
Stock Split Calendar /
Mortgage Calculator /
Donate
Copyright © 2004-2023, MyPivots. All rights reserved.
Copyright © 2004-2023, MyPivots. All rights reserved.