ES trading 4-5-11
I just updated my video from Friday which hopefully has better sound...please let me know if you can actually hear this one
as long as this OR low can hold without a volume break they will try for that 29.75 area...
Hey Lisa,
It sounds like you're busy now, but if you get the time, maybe you could create a short video for us showing the live action? This way instead of Skyping with just one individual, everyone here can view the video and learn from it. Thanks for your efforts to explain things, it's very appreciated.
It sounds like you're busy now, but if you get the time, maybe you could create a short video for us showing the live action? This way instead of Skyping with just one individual, everyone here can view the video and learn from it. Thanks for your efforts to explain things, it's very appreciated.
Originally posted by Lisa P
Hello guys. I am in and out these days, so hard participate in discussion. My offer to connect on Skype still stands.
I track high volumes that I see of bids and asks. SOmetimes it comes at "levels of interest", sometimes not. When I see high volume, I assume that a party (I call Mr. BigWig) entered the market. IF it makes sense to me, I join the party.
After the big order appears, Mr BigWIg often makes progress in the direction entered. Sometimes Mr. Big Wig fails to move market in the desired direction. The following exit often triggers a violent move, especially in thin market - not my favorite time to trade.
As Lorn mentioned before, sometimes Mr. BigWig (and others who join the effort) tries move the market, say to sell, but find a responsive buyer. That often happends in the area of previous strong move origins - those single prints at the beginning of the strong move. I imagine that there are "residual orders" from that big move. These orders can just sit there waiting for the price to come to them. If the responsive buyers (they just absorb the bid and do not hit the ask) still has enough contracts and Mr BigWig and Co cannot push through, he covers fast and fusrious.
Bruce, this is no different than you trading your "significant levels". Sometimes market turns there, sometimes not. When you trying to fade a trend you never know the outcome of your effort - that is why you have stops.
I post when I see Mr Big Wig's footprint - large number. Best time to enter a "fade" trade against the trend is on retest of that level with lower volume, sometimes multiple retests. That oppportunity does not always occur. Sometimes it is "start and drive", the responsive order is larger than Mr BigWIg's effort. There is no way of knowing that - I can only watch Mr BigWig's effort and see if he is #winning (lol) or failing. Same as trading your levels, Bruce.
When I see accumilation of contracts or a single large order pops up I see it in development, whereas my posts are static. OFten observing the action helps, as I see the waves of effort. As my charst are "point and figure" the post does not show the accumulative action to fill those prints.
Frankly, sometimes watching bid-ask action helps, sometimes not. IT is same with watching time and sales when one takes a trade.
Sorry for the long post. Not sure if I answered your questions. If you have more, I would be happy to answer. IT is tough to use this Forum as a discussion. I repeat my offer to connect on Skype.
less buying on that last big 5 min bar up than selling on the previous big bar down!
Thanks for your postings Lisa, this description is excellent. Lines up with a lot of what I see also.
This fits "hand in glove" with Lorn's use of his CD chart divergence setup.
Throw in a $TICK divergence for a cherry on top !
This fits "hand in glove" with Lorn's use of his CD chart divergence setup.
Throw in a $TICK divergence for a cherry on top !
Originally posted by Lisa P
I post when I see Mr Big Wig's footprint - large number. Best time to enter a "fade" trade against the trend is on retest of that level with lower volume, sometimes multiple retests. That oppportunity does not always occur. Sometimes it is "start and drive", the responsive order is larger than Mr BigWIg's effort.
Crap.. i lowered my stop too early i think after i took one off at 1326.25 to break even!(1328.25).. currently flat,up 2 on the day ..re selling 1329.75..expecting 1330.00-1330.50
short 29.75
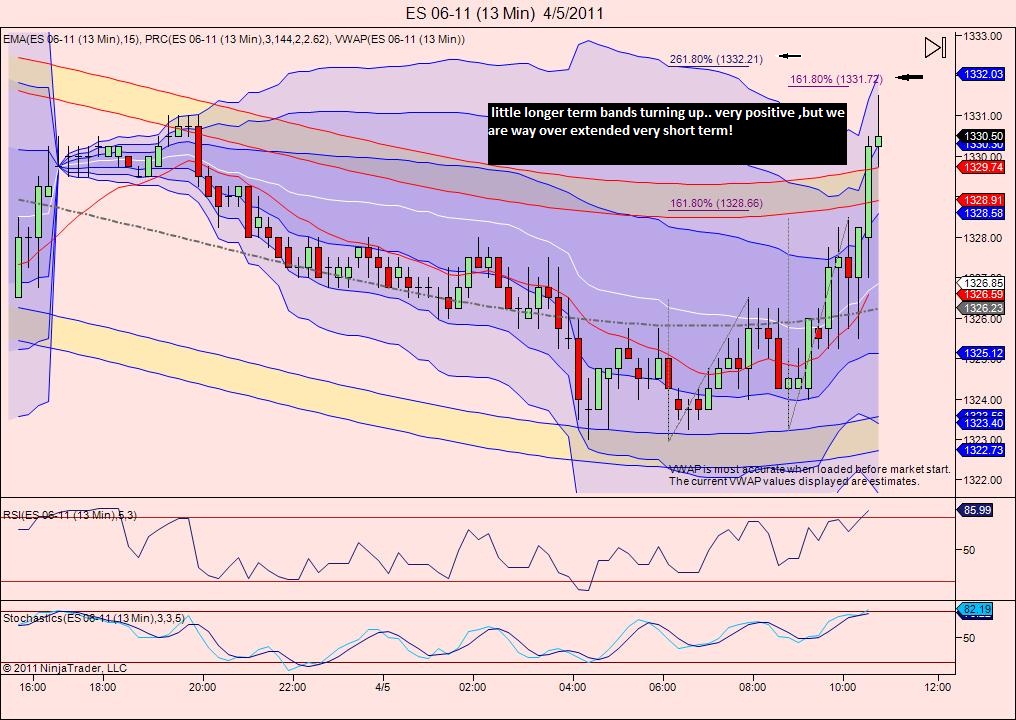
guess i should have waited for the 1330.50 projection!... short from 1329.75 stop 2 handles... dont want to see a new high now.. although i should point out the avg's on the 5 min are beginning to cross for a bullish trend signal, and there does appear to be more buying than selling(as opposed to my previous comment!)..still i think this may be worth a shot!
Click image for original size
still short from 29.75. will add at 32.50
easy come, easier go! stopped for a 2 handle loss on each!..down 2 on the day.. watching and wishing i got in at 1330.50,then my stop would have protected me here.. should have looked at the longer term chart first!
something to check out looking at end of day where were they all
http://www.cmegroup.com/popup/mdq2.html?code=ESM1&title=June_2011_E_mini_S_P_500_(Dollar)&type=v
http://www.cmegroup.com/popup/mdq2.html?code=ESM1&title=June_2011_E_mini_S_P_500_(Dollar)&type=v
Emini Day Trading /
Daily Notes /
Forecast /
Economic Events /
Search /
Terms and Conditions /
Disclaimer /
Books /
Online Books /
Site Map /
Contact /
Privacy Policy /
Links /
About /
Day Trading Forum /
Investment Calculators /
Pivot Point Calculator /
Market Profile Generator /
Fibonacci Calculator /
Mailing List /
Advertise Here /
Articles /
Financial Terms /
Brokers /
Software /
Holidays /
Stock Split Calendar /
Mortgage Calculator /
Donate
Copyright © 2004-2023, MyPivots. All rights reserved.
Copyright © 2004-2023, MyPivots. All rights reserved.