ES 4-8-2011
Thanks Lorn
Now, today, that activity bar on TS had AH HVN identical to yours.
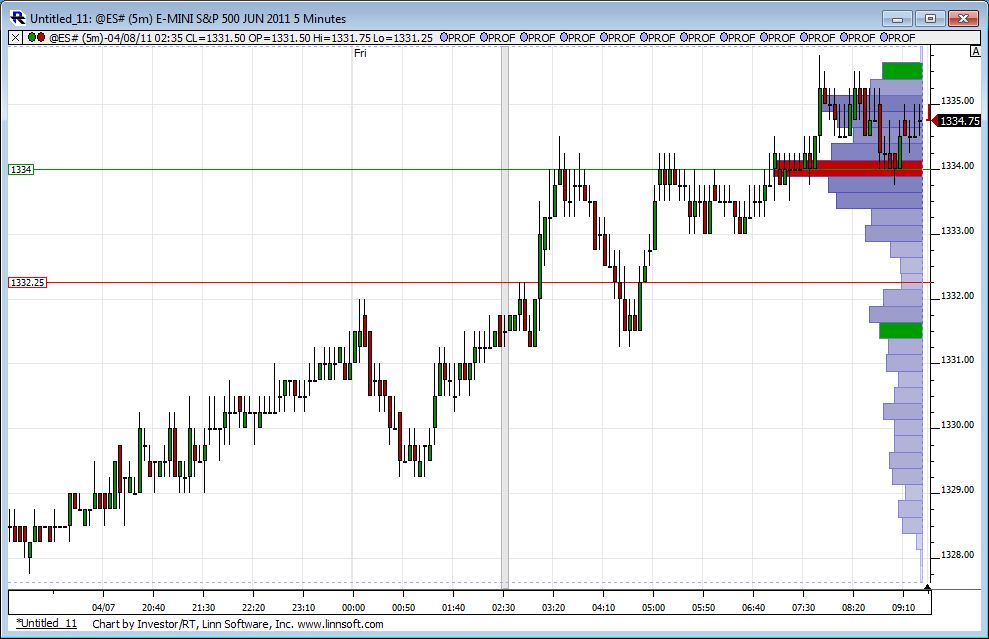
I am looking at a chart, RTH only 5m bars, this is a potential Wyckoff UPtrhust (reversal pattern where previous swing high is taken out by a tick or 2 and instead of attracting buyers on a breakout, proves to be a fakeout and the sellers take control)
Chance of Upthrust increses unless price gets back above AH Midpoint 31.75 and that 31.75 acts like support.
Now, today, that activity bar on TS had AH HVN identical to yours.
I am looking at a chart, RTH only 5m bars, this is a potential Wyckoff UPtrhust (reversal pattern where previous swing high is taken out by a tick or 2 and instead of attracting buyers on a breakout, proves to be a fakeout and the sellers take control)
Chance of Upthrust increses unless price gets back above AH Midpoint 31.75 and that 31.75 acts like support.
And of course the reversal here just so happened to be the O/N high.
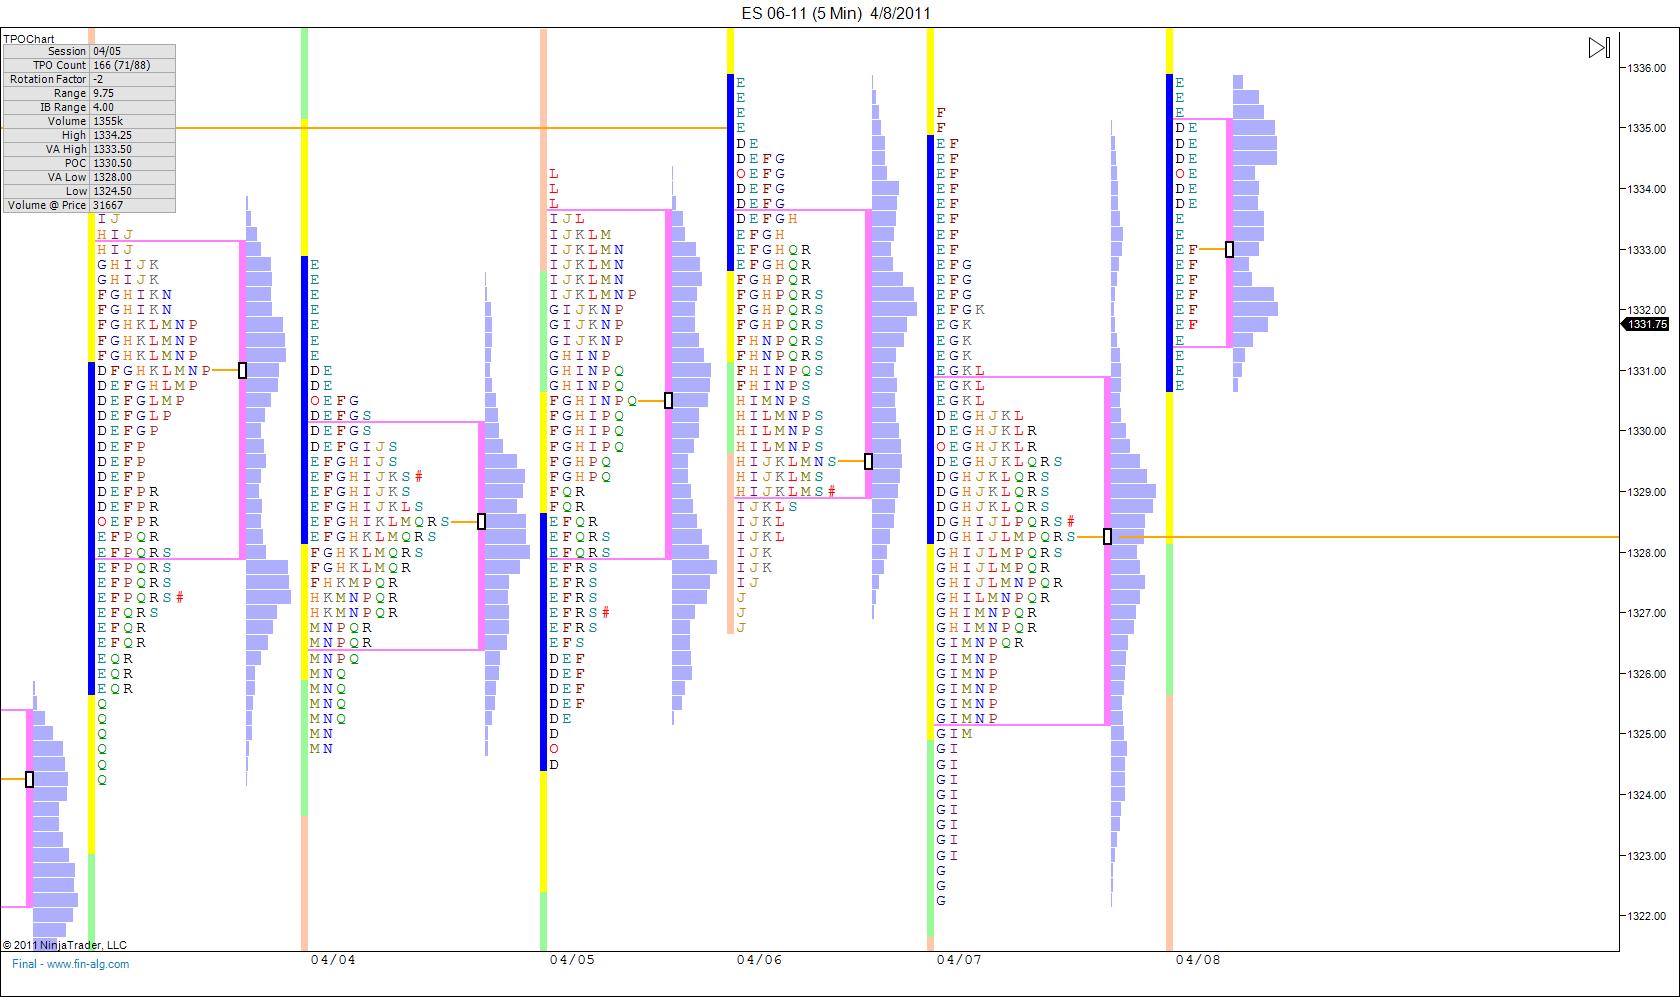
Today open outside yesterdays bracket which also made this a high probably short this morning.
Click image for original size
Two taps of the VWAP and off we go !
vwap on what time frame and setting?
This is where 11AM bears entered
Click image for original size

I have VWAP set for 24hr period. The time frame doesn't matter.
Originally posted by optimusprime
vwap on what time frame and setting?
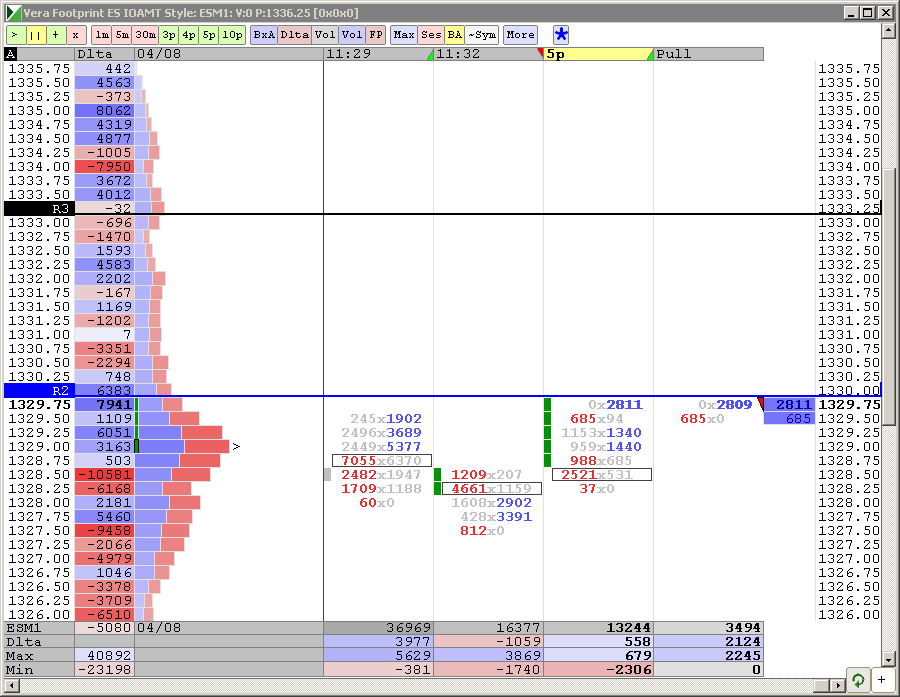
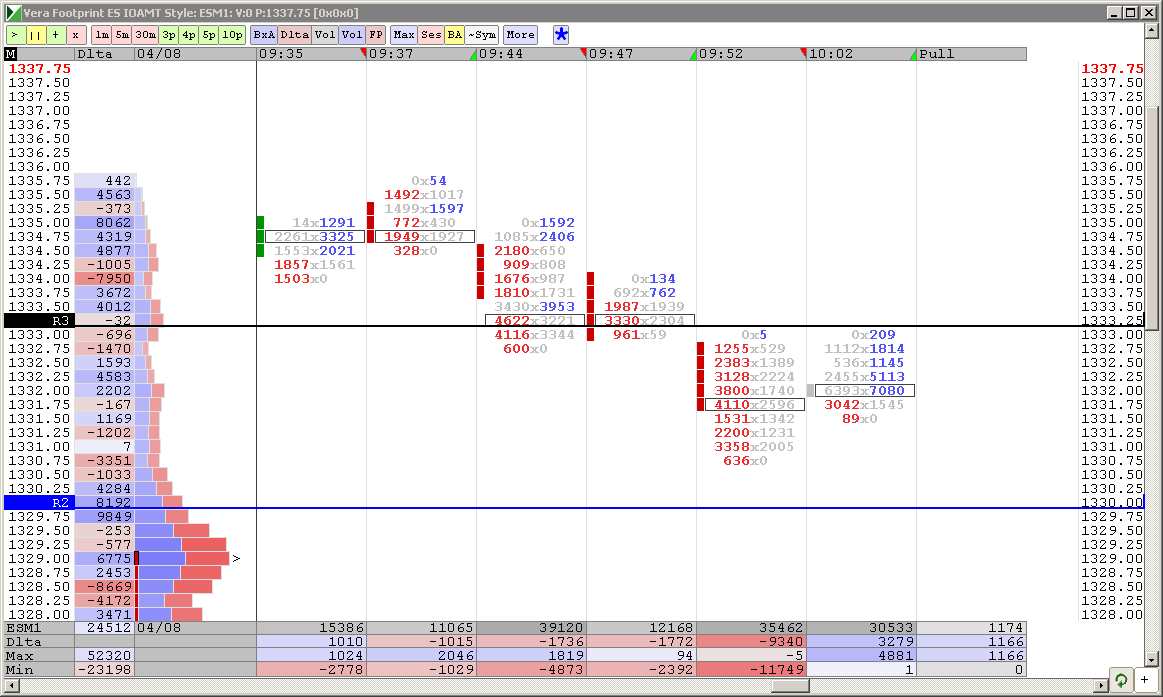
Bid-ask update. Bears could not push through. When price rose above higest volume cell (black border in 11:29 column), they covered.
Click image for original size
i have 22-22.5 as the next big area of support...24-24.5 could prove a temporary one if we are headed that way...on the upside i am a seller at 32.5-33 and then again at the hod/on high...had decent support in the 27.25-27.75 area which worked out fine...good luck
Lisa,
Mine are 5 minute bars.........yours seem different...have a safe trip
Mine are 5 minute bars.........yours seem different...have a safe trip
Originally posted by Lisa P
BruceM, my chart for the same period of time looks completely different - see below. Check your settings. Sorry cannot help more - leaving soon.
Originally posted by BruceM
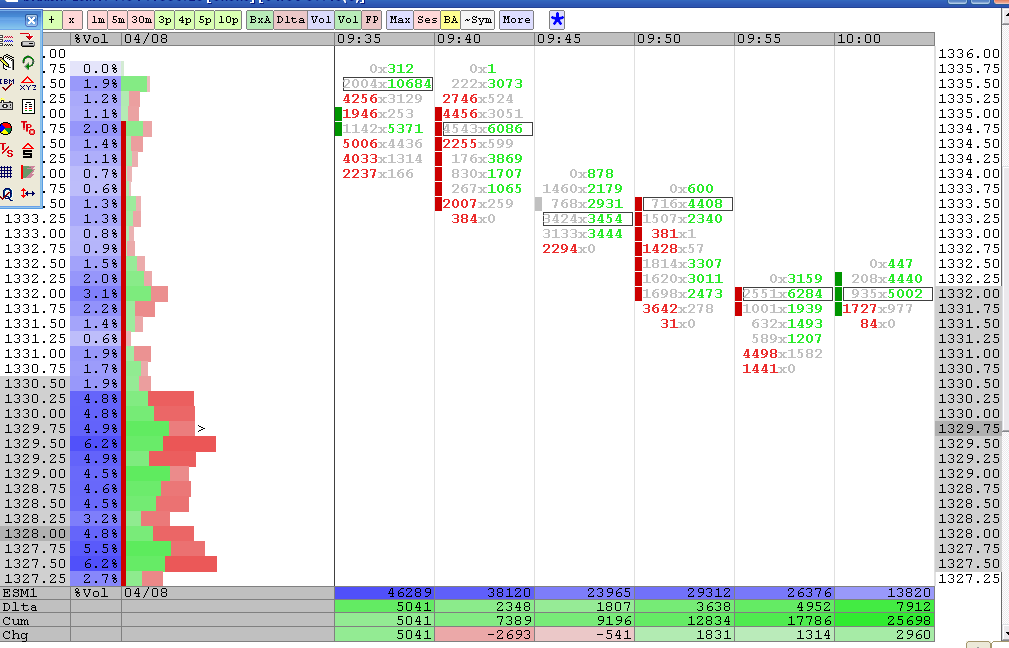
here is a case in point from the opening today of RTH...look at all that Green and cumulative delta is increasing on the way down..couldn't this just be the smart sellers exiting from the O/N positions?
The market never went up above 1333 after that swing low...
how to interpret this ?
Click image for original size
Click image for original size
Emini Day Trading /
Daily Notes /
Forecast /
Economic Events /
Search /
Terms and Conditions /
Disclaimer /
Books /
Online Books /
Site Map /
Contact /
Privacy Policy /
Links /
About /
Day Trading Forum /
Investment Calculators /
Pivot Point Calculator /
Market Profile Generator /
Fibonacci Calculator /
Mailing List /
Advertise Here /
Articles /
Financial Terms /
Brokers /
Software /
Holidays /
Stock Split Calendar /
Mortgage Calculator /
Donate
Copyright © 2004-2023, MyPivots. All rights reserved.
Copyright © 2004-2023, MyPivots. All rights reserved.