ES 4-8-2011
Lisa , you mentioned via email that traders may accumulate in "-2-3-4 tics" so I guess my question is that it may be possible that they distribute the same way....They sell out their longs with a market order if it tics back on them from a certain price point....lets say they sell some with a market order to cover longs at point "X" ..because price dropped from price of x + 1 tic...then maybe the market goes two tics up and then back down so they sell out at "X "...etc , etc...with market orders....
The basic idea is that price isn't going up for them fast enough so they are exiting quickly at different tic values..with market orders....wouldn't this look like selling on the bid side? This would go well with your theory that the Block trades don't function the way I think they may..In other words the big traders will enter and exit in pieces too...according to what you have said
It seems we still really haven't answered the question ...which is how do we see fresh sellers ( in this example) and those just wanting to exit quickly in pieces from their long holdings.....I don't think the bid/ask - footprint will show us that and I'm not sure anything will..
I'm not trying to be a pain here but I want to understand the logic and right now I don't....
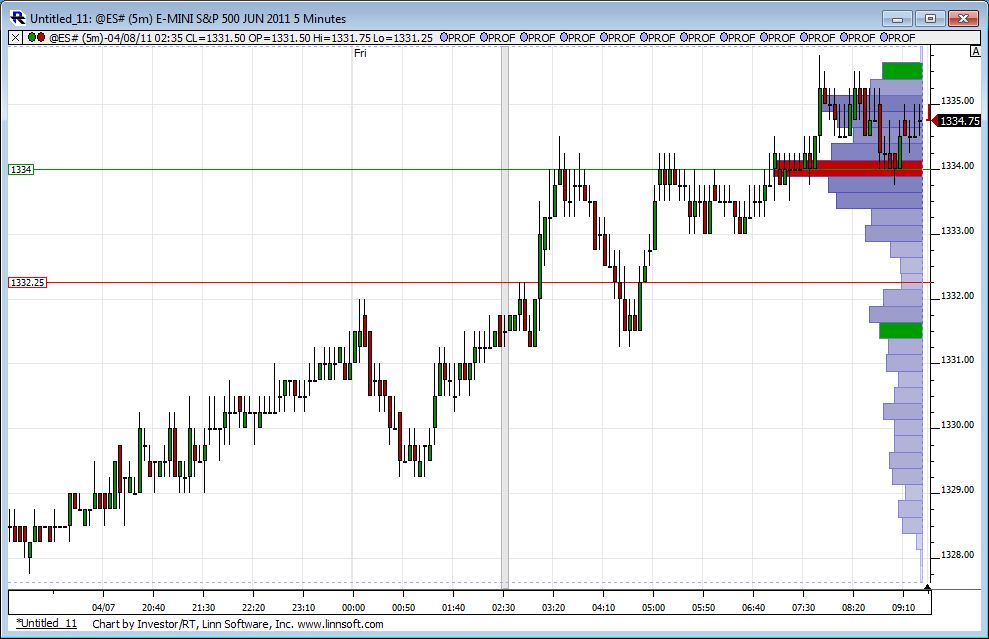
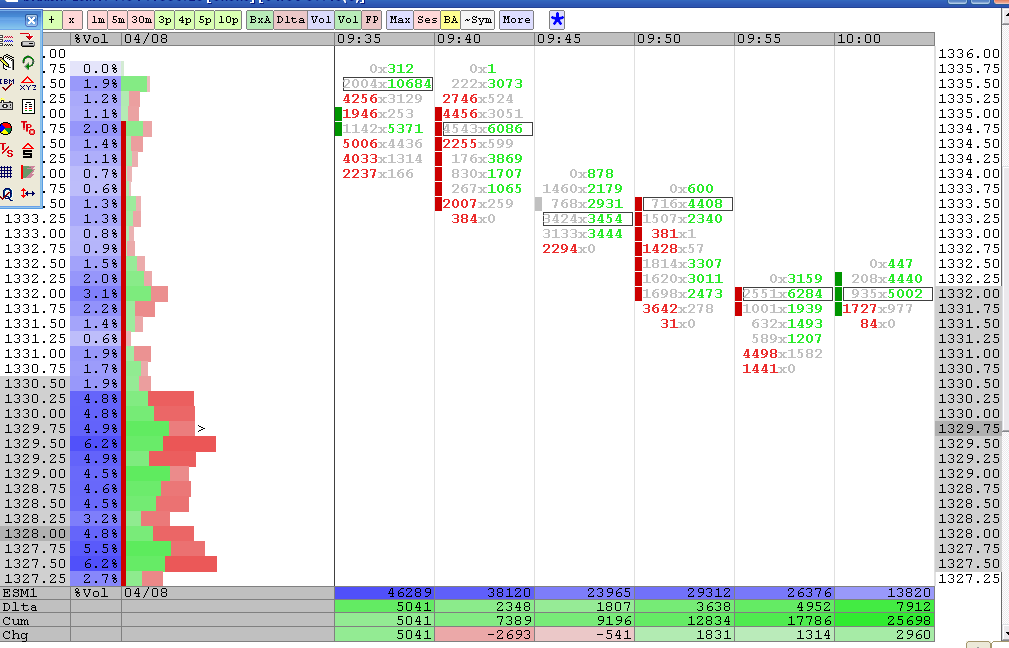
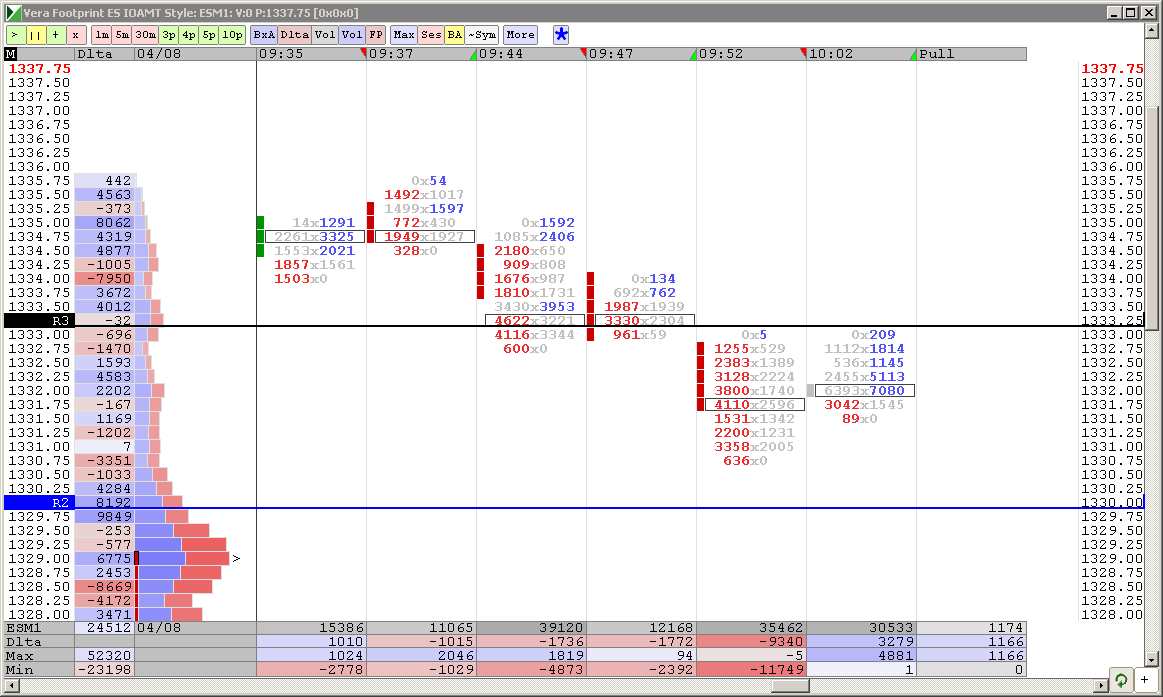
here is a case in point from the opening today of RTH...look at all that Green and cumulative delta is increasing on the way down..couldn't this just be the smart sellers exiting from the O/N positions?
The market never went up above 1333 after that swing low...
how to interpret this ?
The market never went up above 1333 after that swing low...
how to interpret this ?
Click image for original size
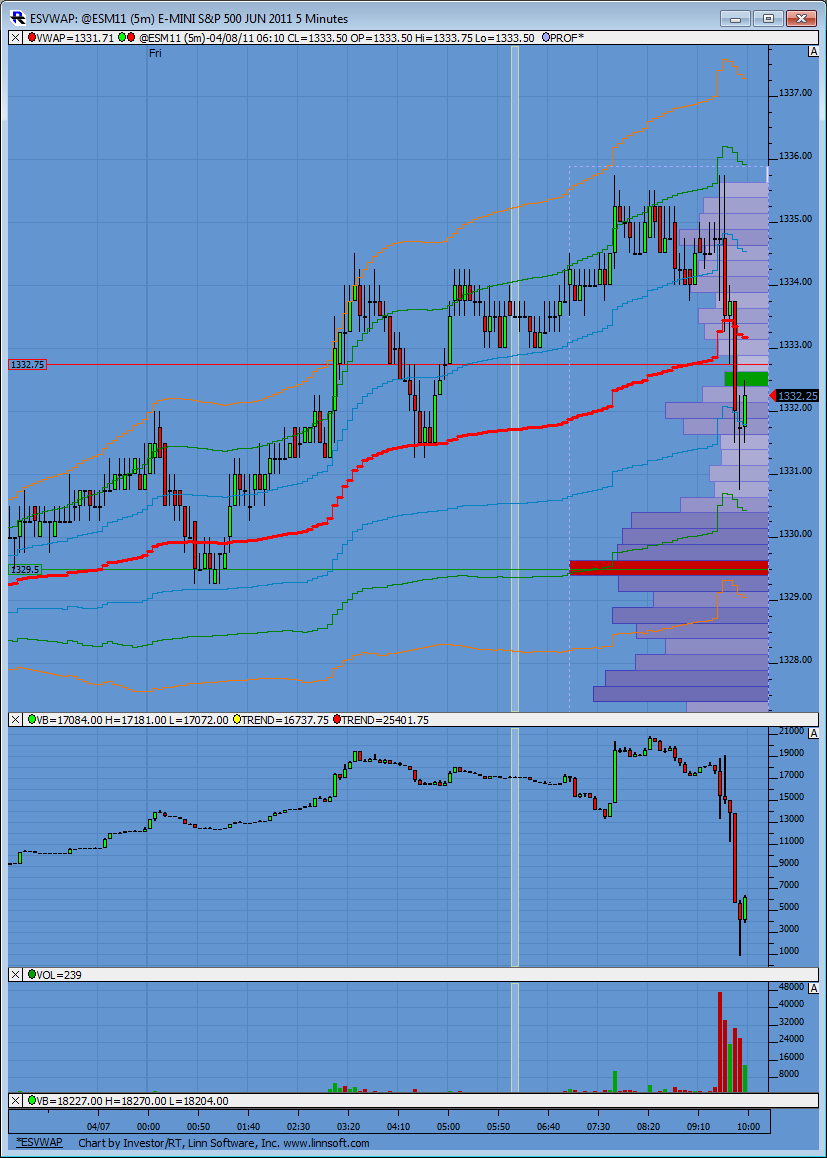
Here is the same time frame you are showing Bruce but plotted as a Cumulative Delta bar. It gives you a completely different picture of what is happening then the footprint bar imo. You can see the O/N high established a high in CD. As RTH opened and the O/N was challenged CD remained lower. Sell off into VWAP with brief support before selling off into the rest of the day.
Of course as you and BeyondMP say we don't know if these are sellers selling or buyers covering or vice versa....
Frankly, I'm not sure if knowing that is all important.
Using BeyondMP's terminology, the "event" which happened was the establishment of the high in CD at the O/N high.
The challenge of this "event" was the RTH challenge of the O/N high. The confirmation of the "event" was CD remaining below its corresponding high and reversing sharply as price failed at the O/N high.
Where/when a trader should enter short this trade in my opinion is as close to 1335.75 as emotionally and skillfully able so that risk can be kept to a minimum.
The trade will quickly tell us if the "event" has suddenly changed.
Of course this is all probably statistical coincidences....so might as well just sit back and keep the stats.
Click image for original size
old peak volume at 1321.25...for those daring to buy on a trend down day
Thank you Lorn
To clarify-
Statistical coincidences= Using some information point on a chart, O/N hi for example, and trading against it just because it was the O/N hi.
Event= An event that causes price movement.
In your example the change in Cum Delta could be considered the "event". Price moved down because there was more selling than buying, not because we hit the O/N hi. If there wasn't a change in Cum Delta price would not have gone down and shorting the O/N would not have worked out.
ha, i was one of them...per my previous note, i bot 21.5 (right around the 22 area i thought it would initially hold) with my usual 3 point stop...they forgot to go a tick further to stop me out, very lucky i guess, got out at b/e on the way back up...awful trade on my part as i usually trade on es fib projections when they match some established support/resistance levels on the ym charts i also watch...to make a long story short, 300 was support on ym and so was 270, but my buy level in es corresponded to a level was right in between those ym supports and i don't know how i did not see that before doing the trade...long day and week i guess...done for today...time for a cold beer i guess...good w/e
Originally posted by BruceM
old peak volume at 1321.25...for those daring to buy on a trend down day
troubling as usual that your CD was in a downtrend while mine was in an uptrend....zoinks..!! good chart though Lorn..thanks
Yes its quite possible if Cum Delta hadn't gone down price would have gone up and shorting the O/N high wouldn't have worked out.
Being a trader unfortunately requires that I make decisions without 100% clarity of information being broadcast to me.
Have a good weekend my friend!
Being a trader unfortunately requires that I make decisions without 100% clarity of information being broadcast to me.
Have a good weekend my friend!
Originally posted by beyondMP
In your example the change in Cum Delta could be considered the "event". Price moved down because there was more selling than buying, not because we hit the O/N hi. If there wasn't a change in Cum Delta price would not have gone down and shorting the O/N would not have worked out.
I find the safest trades are when we break through and come back up for the retest....Like the 28.50 - 29 area....it is better to get below and then look at volume dry ups.....WHEN WE ENTER THE ZONE INITIALLY FROM ABOVE THEM....
So If we enter a zone from below it is safer to get above the zone and watch to see if volume will dry up as we try to push above...then go short..
So If we enter a zone from below it is safer to get above the zone and watch to see if volume will dry up as we try to push above...then go short..
Originally posted by apk781
ha, i was one of them...per my previous note, i bot 21.5 (right around the 22 area i thought it would initially hold) with my usual 3 point stop...they forgot to go a tick further to stop me out, very lucky i guess, got out at b/e on the way back up...awful trade on my part as i usually trade on es fib projections when they match some established support/resistance levels on the ym charts i also watch...to make a long story short, 300 was support on ym and so was 270, but my buy level in es corresponded to a level was right in between those ym supports and i don't know how i did not see that before doing the trade...long day and week i guess...done for today...time for a cold beer i guess...good w/e
Originally posted by BruceM
old peak volume at 1321.25...for those daring to buy on a trend down day
I would be totally confused looking at that delta chart as well Bruce.
For comparison, here is my 4 range chart of the same time frame, using your BidxAsk ladder style...
On this chart Selling is shown by a red candle color and negative delta number in the bottom table. Conversely, Buying has a green candle and positive delta.
Notice the two red selling phases highlighted on my chart are shown by the two long red candles on your chart.
For comparison, here is my 4 range chart of the same time frame, using your BidxAsk ladder style...
On this chart Selling is shown by a red candle color and negative delta number in the bottom table. Conversely, Buying has a green candle and positive delta.
Click image for original size
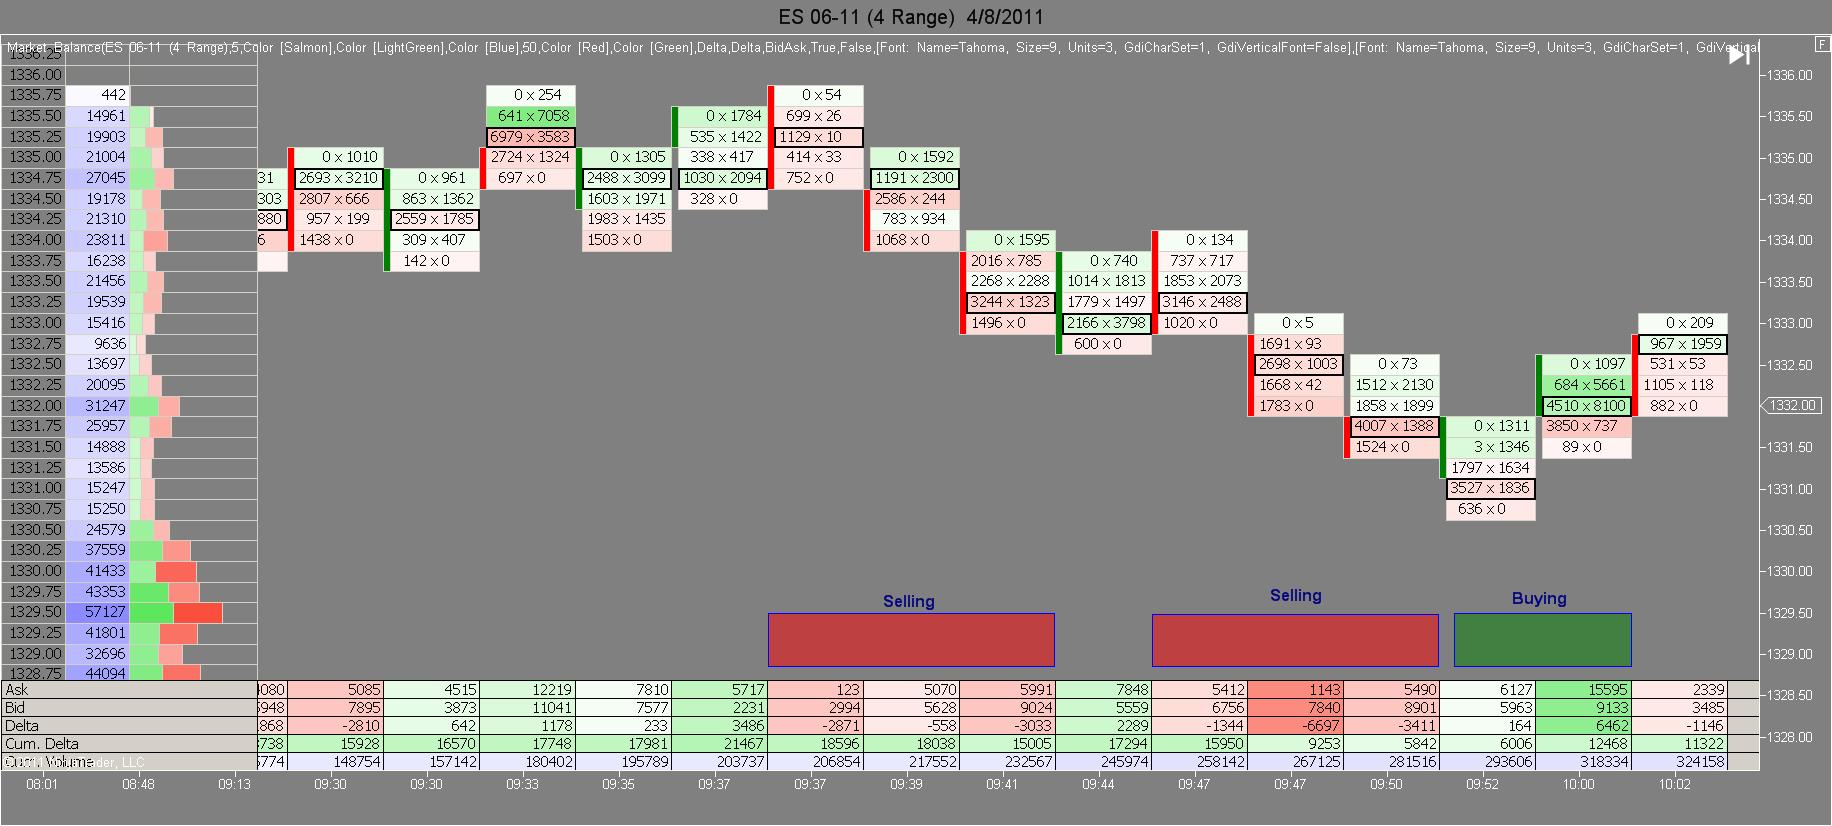
Notice the two red selling phases highlighted on my chart are shown by the two long red candles on your chart.
Originally posted by BruceM
here is a case in point from the opening today of RTH...look at all that Green and cumulative delta is increasing on the way down..couldn't this just be the smart sellers exiting from the O/N positions?
how to interpret this ?
Click image for original size
Lisa,
Mine are 5 minute bars.........yours seem different...have a safe trip
Mine are 5 minute bars.........yours seem different...have a safe trip
Originally posted by Lisa P
BruceM, my chart for the same period of time looks completely different - see below. Check your settings. Sorry cannot help more - leaving soon.
Originally posted by BruceM
here is a case in point from the opening today of RTH...look at all that Green and cumulative delta is increasing on the way down..couldn't this just be the smart sellers exiting from the O/N positions?
The market never went up above 1333 after that swing low...
how to interpret this ?
Click image for original size
Click image for original size
Emini Day Trading /
Daily Notes /
Forecast /
Economic Events /
Search /
Terms and Conditions /
Disclaimer /
Books /
Online Books /
Site Map /
Contact /
Privacy Policy /
Links /
About /
Day Trading Forum /
Investment Calculators /
Pivot Point Calculator /
Market Profile Generator /
Fibonacci Calculator /
Mailing List /
Advertise Here /
Articles /
Financial Terms /
Brokers /
Software /
Holidays /
Stock Split Calendar /
Mortgage Calculator /
Donate
Copyright © 2004-2023, MyPivots. All rights reserved.
Copyright © 2004-2023, MyPivots. All rights reserved.