ES 4-8-2011
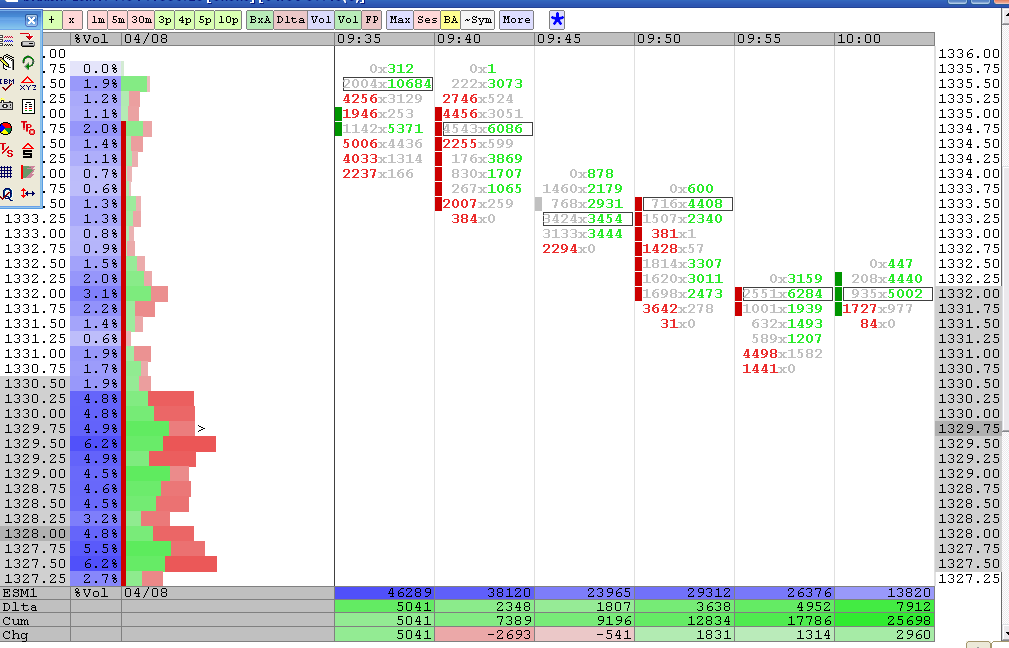
BruceM, my chart for the same period of time looks completely different - see below. Check your settings. Sorry cannot help more - leaving soon.
Originally posted by BruceM
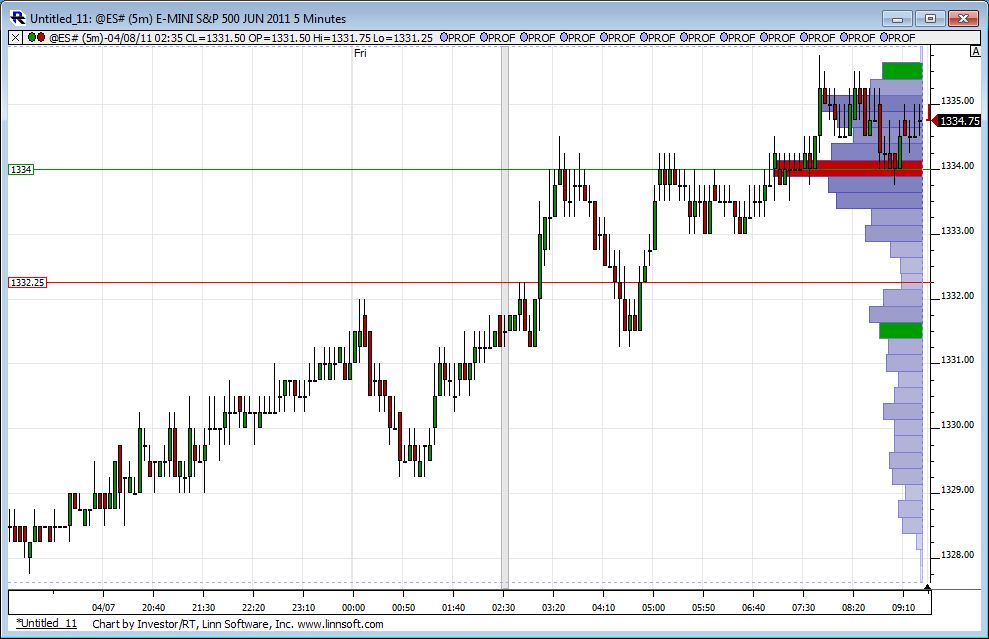
here is a case in point from the opening today of RTH...look at all that Green and cumulative delta is increasing on the way down..couldn't this just be the smart sellers exiting from the O/N positions?
The market never went up above 1333 after that swing low...
how to interpret this ?
Click image for original size
Click image for original size
Good discussion by all.
I will toss my 2 cents in here, just based on my experience using these tools.
The delta chart gives us a unique tool to view and interpret the price action surrounding the various 'statistical market events' Lorn and MPTrader mentioned. Technically the delta chart is showing us 'volume at price action'. In general, I use the delta chart to confirm (or refute) an 'event' as it is occurring.
The delta chart gives us a direct and unobstructed (not distorted or delayed) view of price acceptance and rejection.
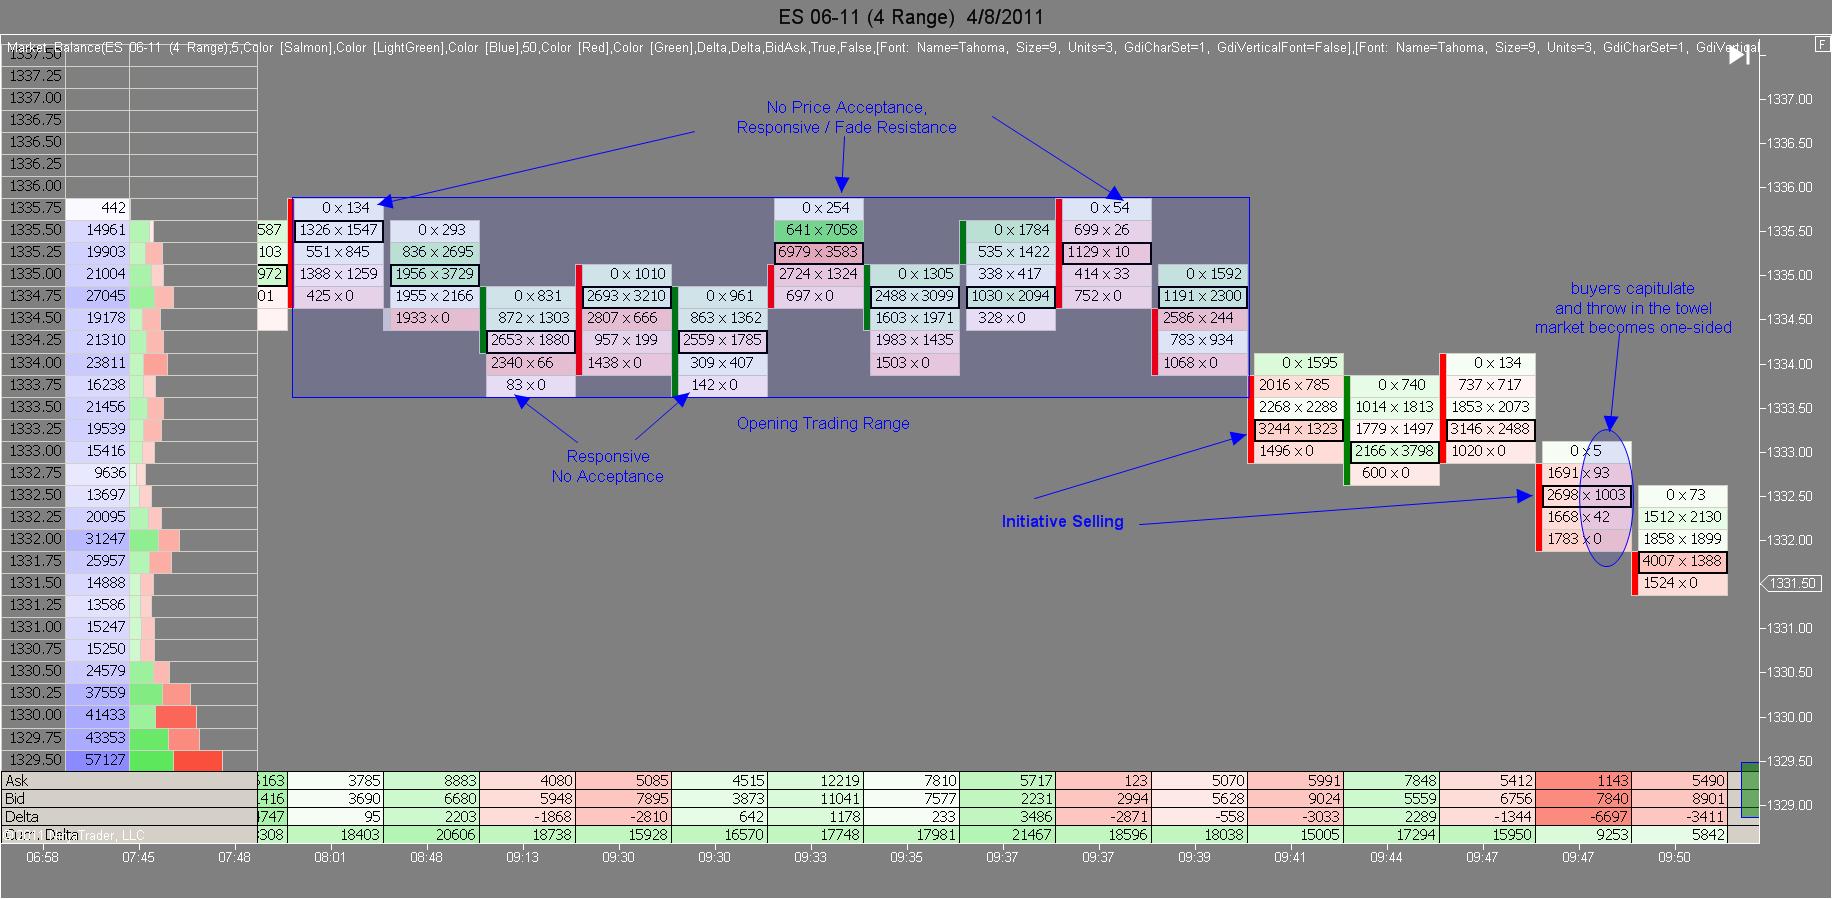
I think it might help if we review the basics of Auction Market Theory. Initiative traders enter the market as price moves away from (breaks away from) value in the direction of the price breakout. Initiative traders in this case always leave the footprint of high volume acceptance of the new price extreme. So in the example below, we saw initiative selling when the opening range was broken. We know it is initiative because we clearly see heavy sell side volume at a new price low at the range break point. The surge of heavy volume tells us lower prices are being accepted. If responsive traders were in control of the market at the new price low (fading the breakout), then there would not be any price acceptance, IE. we would see low selling volume as price attempts to break through the range boundary. In this example we see the opposite, with strong price acceptance (heavy sell side volume) on the range breakout. Any responsive traders attempting to fade the breakout were run over by the huge surge of initiative selling flooding in at the new price low. This is initiative market behavior.
I will toss my 2 cents in here, just based on my experience using these tools.
The delta chart gives us a unique tool to view and interpret the price action surrounding the various 'statistical market events' Lorn and MPTrader mentioned. Technically the delta chart is showing us 'volume at price action'. In general, I use the delta chart to confirm (or refute) an 'event' as it is occurring.
The delta chart gives us a direct and unobstructed (not distorted or delayed) view of price acceptance and rejection.
I think it might help if we review the basics of Auction Market Theory. Initiative traders enter the market as price moves away from (breaks away from) value in the direction of the price breakout. Initiative traders in this case always leave the footprint of high volume acceptance of the new price extreme. So in the example below, we saw initiative selling when the opening range was broken. We know it is initiative because we clearly see heavy sell side volume at a new price low at the range break point. The surge of heavy volume tells us lower prices are being accepted. If responsive traders were in control of the market at the new price low (fading the breakout), then there would not be any price acceptance, IE. we would see low selling volume as price attempts to break through the range boundary. In this example we see the opposite, with strong price acceptance (heavy sell side volume) on the range breakout. Any responsive traders attempting to fade the breakout were run over by the huge surge of initiative selling flooding in at the new price low. This is initiative market behavior.
Click image for original size
Originally posted by BruceM
Lisa , you mentioned via email that traders may accumulate in "-2-3-4 tics" so I guess my question is that it may be possible that they distribute the same way....They sell out their longs with a market order if it tics back on them from a certain price point....lets say they sell some with a market order to cover longs at point "X" ..because price dropped from price of x + 1 tic...then maybe the market goes two tics up and then back down so they sell out at "X "...etc , etc...with market orders....
The basic idea is that price isn't going up for them fast enough so they are exiting quickly at different tic values..with market orders....wouldn't this look like selling on the bid side? This would go well with your theory that the Block trades don't function the way I think they may..In other words the big traders will enter and exit in pieces too...according to what you have said
It seems we still really haven't answered the question ...which is how do we see fresh sellers ( in this example) and those just wanting to exit quickly in pieces from their long holdings.....I don't think the bid/ask - footprint will show us that and I'm not sure anything will..
I'm not trying to be a pain here but I want to understand the logic and right now I don't....
Lisa,
Mine are 5 minute bars.........yours seem different...have a safe trip
Mine are 5 minute bars.........yours seem different...have a safe trip
Originally posted by Lisa P
BruceM, my chart for the same period of time looks completely different - see below. Check your settings. Sorry cannot help more - leaving soon.
Originally posted by BruceM
here is a case in point from the opening today of RTH...look at all that Green and cumulative delta is increasing on the way down..couldn't this just be the smart sellers exiting from the O/N positions?
The market never went up above 1333 after that swing low...
how to interpret this ?
Click image for original size
Click image for original size
Emini Day Trading /
Daily Notes /
Forecast /
Economic Events /
Search /
Terms and Conditions /
Disclaimer /
Books /
Online Books /
Site Map /
Contact /
Privacy Policy /
Links /
About /
Day Trading Forum /
Investment Calculators /
Pivot Point Calculator /
Market Profile Generator /
Fibonacci Calculator /
Mailing List /
Advertise Here /
Articles /
Financial Terms /
Brokers /
Software /
Holidays /
Stock Split Calendar /
Mortgage Calculator /
Donate
Copyright © 2004-2023, MyPivots. All rights reserved.
Copyright © 2004-2023, MyPivots. All rights reserved.