ES Trading for 4-11-11
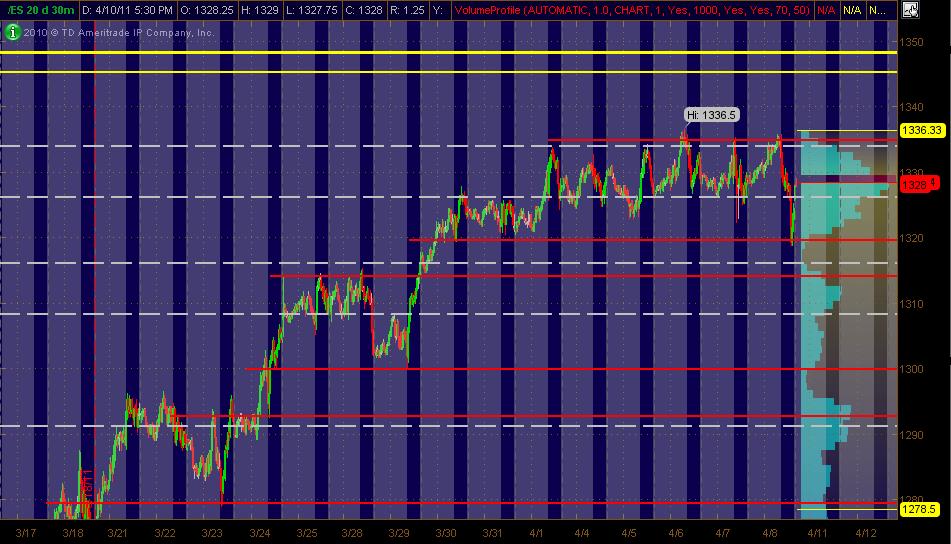
Here's my MAP of the ES coming into the week ... 30min chart of 20 days with Volume Profile on the right vertical axis. The PASR levels are RED with the WHITE dashed lines being Weekly Pivots per mypivots.com with YELLOW lines being a "zone" of what I've got as potentially significant FIB clusters. Hope it's helpful
Click image for original size
Originally posted by BruceM
what's the best visual to relate the CD ( volume) to the total volume..? not sure if that makes sense as a question...
This is actually the most important answer.
The piece most miss is that you have to compare delta to price movement not volume. The key is how much delta is needed to move price "x" number of ticks, not how much is needed to overcome previous volume. Volume is dynamic, the flow is always changing-different buyers and sellers participating in the market for different reasons. But on a highly liquid instruments there are always some participants(sometimes algo's) looking to take advantage of imbalances. It is possible to hide in volume, but not in delta.
I'm no math wizard but are you talking about creating some kind of rate of change indicator with price and delta..? I'd be interested in learning more about how to look for this distiction...
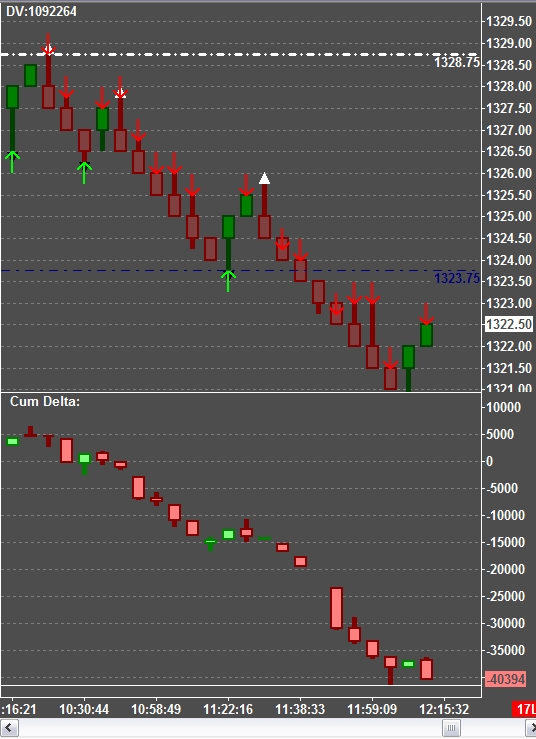
Very insightful Beyond. Would you mind posting a few more of those screens, so we can see how the cum delta chart works. Maybe the 10:30-12:00 time if you don't mind. Thank you very much.
Originally posted by beyondMP
Originally posted by BruceM
what's the best visual to relate the CD ( volume) to the total volume..? not sure if that makes sense as a question...
This is actually the most important answer.
The piece most miss is that you have to compare delta to price movement not volume. The key is how much delta is needed to move price "x" number of ticks, not how much is needed to overcome previous volume. Volume is dynamic, the flow is always changing-different buyers and sellers participating in the market for different reasons. But on a highly liquid instruments there are always some participants(sometimes algo's) looking to take advantage of imbalances. It is possible to hide in volume, but not in delta.
thanks beyond...would you mind posting the settings you use in your sierra charts? i happen to have sierra and would be interested in plotting it (with a different data source for now though)...thanks !
Originally posted by beyondMP
I use DTN for my data, for the price it has the best bid/ask data. If you only rely on your brokers data feed, you will never know when there is a problem, until it's to late.
I run it with 24 hr data, just to keep my charts up to date.
The charting package you use is also important. I have tried them all, used IRT/Market Delta but found there was a problem in some of their routines. Ninjatrader is useless for any serious delta work, unless you are willing to coble together third party studies or do the programming yourself.
Finally settled on Sierra Charts, when a legitimate deficiency has been pointed out they do something about it. It also gives the user the greatest ability to adjust how the data is used and displayed, in other words the most customizable without being a programmer.
Originally posted by BruceM
very nice beyond...do u run that just in RTH session...? Lorn has had good results with the combined...
I like the concept......what data feed do u use...? I need a major upgrade for my delta research
I suppose that could be done.
I have established certain thresholds delta must attain over particular price periods for me to take a trade. I try not to become to mechanical but rather study and evaluate market conditions before and during a trade, knowing certain conditions("events") must be met for the trade to work out.
The chart I showed this a.m. was a perfect example of waiting for CD to turn then entering the trade at 29 and riding it down until CD showed a change. I really didn't care where the entry was or the exit in advance, as long as the conditions continued I stayed in the trade. I could tell when you entered you were going to have to endure some pain, but each trader has different tolerances mine are low and I like to wait for the conditions to be "right".
My only point in all of this is give an alternative point of view on trading. To show there are "forces" at work in price movement that can be used to increase a trader's success. Or, even more importantly, limit their failure.
I saw you were having certain reservations concerning the "footprint" charts. I was only trying to save you a little time an effort in throwing out my thoughts.
This turned into a "ramble" and might be better handled in private. Probably not much help to others in the topic, I apologize.
(Wrote that last part before seeing previous posts)
Originally posted by BruceM
I'm no math wizard but are you talking about creating some kind of rate of change indicator with price and delta..? I'd be interested in learning more about how to look for this distiction...
I think the discussion works well here since others may be interested (I am for sure). If the forum gets flooded and there are too many posts, then maybe we could create a new thread, but things are slow enough now that this discussion is very welcome. Thanks.
Originally posted by beyondMP
This turned into a "ramble" and might be better handled in private. Probably not much help to others in the topic, I apologize.
Drob
Click image for original size
Send me private message and I'll send you chartbook, after I clean it up a little.
Too many settings to describe unless you are only interested in the main chart.
Too many settings to describe unless you are only interested in the main chart.
Originally posted by apk781
thanks beyond...would you mind posting the settings you use in your sierra charts? i happen to have sierra and would be interested in plotting it (with a different data source for now though)...thanks !
I think others are VERY interested.......please keep the thoughts coming..
thanks...i did a few minutes back so whenever you have a chance...much appreciated !
Originally posted by beyondMP
Send me private message and I'll send you chartbook, after I clean it up a little.
Too many settings to describe unless you are only interested in the main chart.
[quote]Originally posted by apk781
thanks beyond...would you mind posting the settings you use in your sierra charts? i happen to have sierra and would be interested in plotting it (with a different data source for now though)...thanks !
thanks for explaining that MM. Looks like we are heading down in the overnight to the next key area 1310.50- 1312.50.
Emini Day Trading /
Daily Notes /
Forecast /
Economic Events /
Search /
Terms and Conditions /
Disclaimer /
Books /
Online Books /
Site Map /
Contact /
Privacy Policy /
Links /
About /
Day Trading Forum /
Investment Calculators /
Pivot Point Calculator /
Market Profile Generator /
Fibonacci Calculator /
Mailing List /
Advertise Here /
Articles /
Financial Terms /
Brokers /
Software /
Holidays /
Stock Split Calendar /
Mortgage Calculator /
Donate
Copyright © 2004-2023, MyPivots. All rights reserved.
Copyright © 2004-2023, MyPivots. All rights reserved.