Cumulative Delta
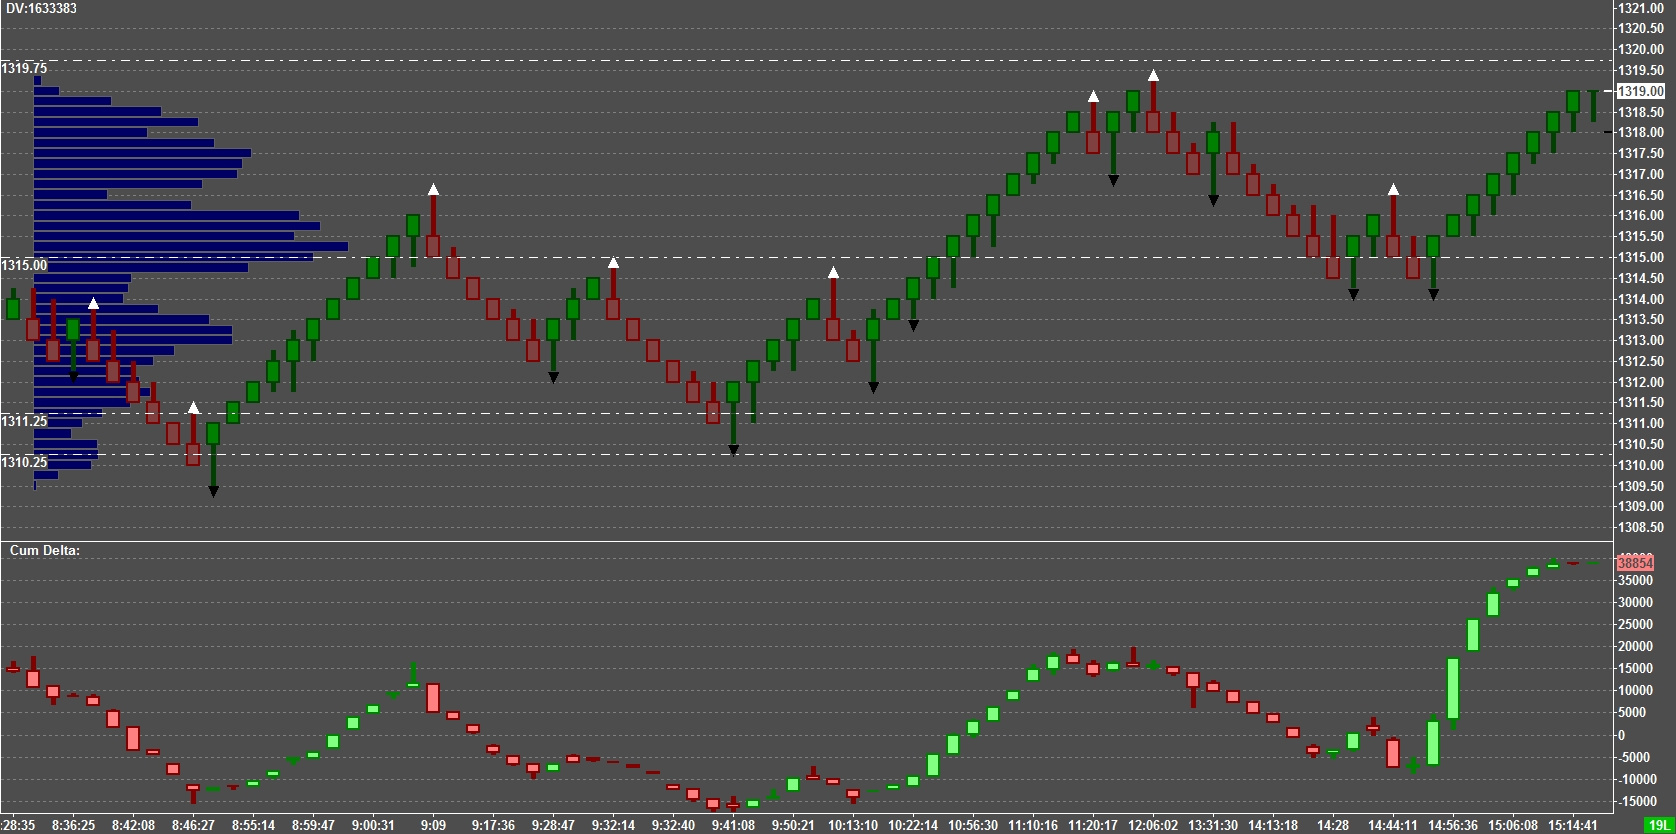
To help illustrate the usefulness of Cum Delta, I'll post some charts. The first ones will have BruceM zones as reference. Hopefully this will stimulate some discussion and sharing of Cum Delta ideas.
Here is Friday 4-15 chart. Volume Profile is on the left side (scroll over)
Click image for original size
IT IS A VERY INTERSTING CHART, CAN YOU TELL ME PLEASE WHAT CHARTING COMPANY OR BROKRAGE FIRMS PROVIDE IT? IS TRADE STATION MATRIX (DOME) PROVIDING THE SAME INFORMATION?
The chart was created using Sierra Charts. I'm not sure that it can be duplicated exactly using any other charting software.
Originally posted by khamore1
IT IS A VERY INTERSTING CHART, CAN YOU TELL ME PLEASE WHAT CHARTING COMPANY OR BROKRAGE FIRMS PROVIDE IT? IS TRADE STATION MATRIX (DOME) PROVIDING THE SAME INFORMATION?
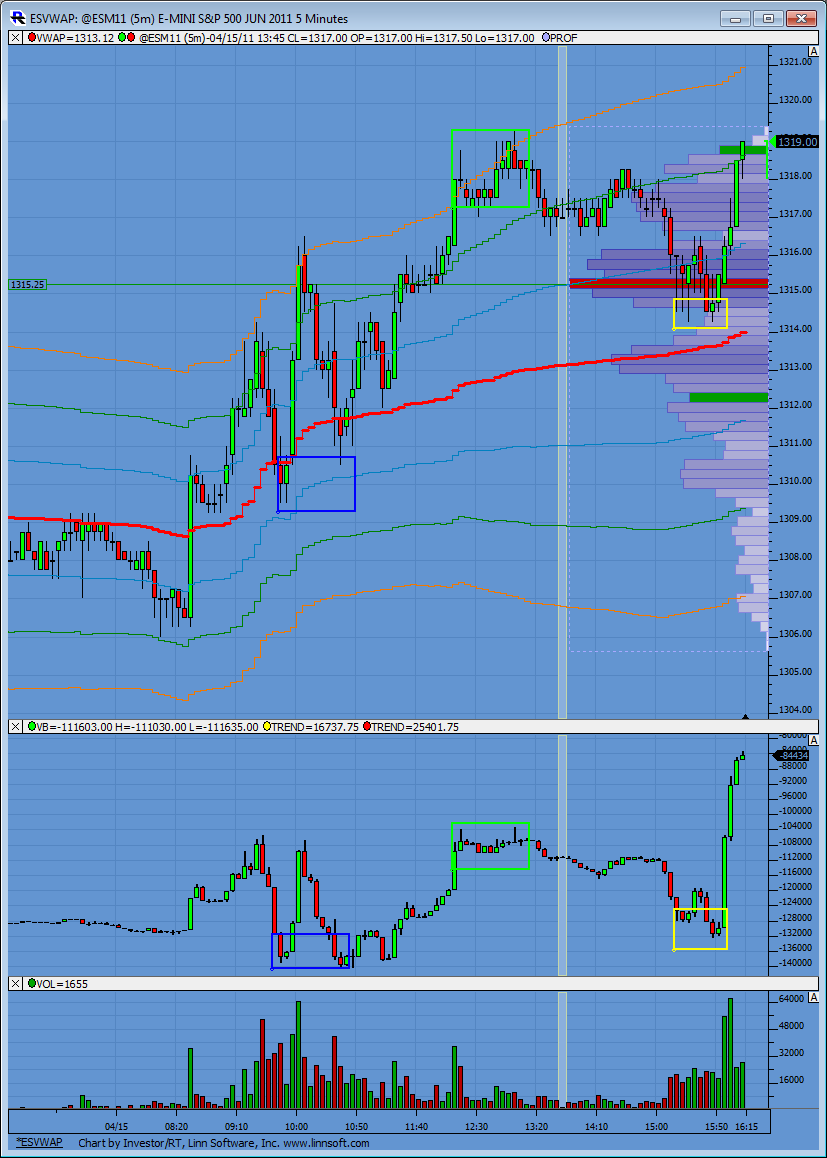
Great chart BeyondMP. Fridays action was a great example of cumulative delta imbalances happening at many of the critical pivots. Here is my 5 min chart to compare to your renko chart. I've put colored rectangles at the areas of interest. Now keep in mind this is my interpretation and by no means the be all or end all of this stuff...
The blue areas. An imbalance in my view is when CD (cumulative delta) punches through a previous threshold (pivot, level whatever you want to call it) while price does not. Kind of like a reverse divergence or some people have even called it a hidden divergence. Notice CD broke below its low set at the 9:50am price while price didn't before a reversal ensued.
The yellow zones at the end of the day shows the same setup. Price make a double bottom while CD breaks to a new low before reversing.
Now on the green zone its difficult to see the imbalance but I marked it anyway because it shows up real nice on BeyondMP's renko chart.
Now I've said this before, when these imbalances happen near/on levels of interest whether they be price or even time or even form I pay attention and look to place a trade.
Others I'm sure can/do use this info is much better ways.
Cheers!
Click image for original size
This is off to a great start. I'm going to keep my questions and comments separate for you both (Lorn and BeyondMP) right now just so I can get a few things clear.
Beyond: Is your primary visual focus the CD (short for Cumulative delta ) when looking at your charts? I assume you aren't trading every flip in CD from up to down or down to up. The reason I ask is because of your statements regarding "The "event"(cum delta) vs. the "coincidence" (volume node 29)" you made in the day trading threads.
This statement seems to imply that it is just a coincidence that price happened to be at a key number when CD flipped as if the volume node doesn't even matter. Yet the chart you have posted here seems to depict the opposite.
I don't want us to get lost or hung up on terminology and that is why I'm looking for clarification. It is my understanding that it is actually not a coincidence that we are getting CD changes at the key numbers.
The "event" takes place because many participants are watching the key prices and act at those prices. I call this market context and the key levels are what I look at first, then I look for signals. So I guess the question boils down to this: Are price levels just a coincidence for you and not even really needed for your style of analysis and trading?
Ok, you have mentioned in private about total volume being part of the CD equation. In order to have a more powerful entry signal ( in your experience) would you prefer to see a CD change on higher total volume than the previous bars in your view or lower volume ? I'm assuming you'd like to see the change on higher volume but I need to ask anyway.
Thanks for kicking off this thread.
So Lorn here is what I have for you so far. Is your primary visual focus the old pivot levels of CD or price? Which is what gets your attention first?
You also show on your chart price breaking out of it's Overnight high while CD was still under it's overnight high. So that is a divergence and would get a green box too. Is that correct ? So do you use any kind of fixed points when snapping your CD lines ? Like the previous real time levels or is it always a constant running chart...hence the name CD...lol? I have questions on divergences and thresholds but will put that in my next post as it pertains to both you and Beyond MP.
You also show on your chart price breaking out of it's Overnight high while CD was still under it's overnight high. So that is a divergence and would get a green box too. Is that correct ? So do you use any kind of fixed points when snapping your CD lines ? Like the previous real time levels or is it always a constant running chart...hence the name CD...lol? I have questions on divergences and thresholds but will put that in my next post as it pertains to both you and Beyond MP.
These questions pertain to certain thresholds of CD and divergences and are meant for anyone willing to contribute.
Suppose we see Price make a new high but CD does not. Are there certain amounts of price movement that bigger traders will "allow" the market to go against them before price snaps back ? In this example price would come back down.
On Lorn's chart near the green box at the highs, price moved about 3 points above the old swing high while CD was barely getting out above it's old highs. Then price snapped back down. Would moving 5 points beyond that swing point for example cause short holders to exit and give up on the fade?
Now look at the first blue box: CD makes a new low but price doesn't ....so is it possible that there are certain limits on CD changes also? Suppose CD went 5000 lower more than the prior swing low ( I'm just throwing that number out there) instead of the 1500 or 2000 difference that the chart seems to show.....Could that imply that price would NOT snap back to the upside and that the CD signal has more pull and price would drop?
I'm not sure if those questions are being articulated correctly. I guess I'm wondering how far CD or price may have to change in order to qualify or disqualify a divergence. How can we improve the odds of figuring out which divergence will win?
We could look at total volume and $tick divergences as a possibility or other market internals. There was a nice $tick and volume divergence at your yellow box high as an example but I don't want to draw the focus away from CD.
BeyondMP...You mentioned in an email that total volume needs to be incorporated into the CD picture...How can we use that concept with divergences?
Reply to BruceM-
The way to judge if something is a coincidence or event is how often it happens. If price changes direction at every key number then the key number could be considered the "event". However, if price changes every time CD changes then CD is the "event", in fact this is what happens(at least to the way I see the markets).
Yes, price levels are just a coincidence for me and not really needed. I try to use the least amount of information to make my trading decisions. I know most traders seem to think the the more they know the better they'll trade; but, I just want the "important" information, everything else just becomes anecdotal and can lead very quickly to "analysis paralysis". I added your levels to my chart to give you context.
Increasing volume can add momentum to a move. But, it is secondary in mind.
I don't want us to get lost or hung up on terminology and that is why I'm looking for clarification. It is my understanding that it is actually not a coincidence that we are getting CD changes at the key numbers.
The way to judge if something is a coincidence or event is how often it happens. If price changes direction at every key number then the key number could be considered the "event". However, if price changes every time CD changes then CD is the "event", in fact this is what happens(at least to the way I see the markets).
The "event" takes place because many participants are watching the key prices and act at those prices. I call this market context and the key levels are what I look at first, then I look for signals. So I guess the question boils down to this: Are price levels just a coincidence for you and not even really needed for your style of analysis and trading?
Yes, price levels are just a coincidence for me and not really needed. I try to use the least amount of information to make my trading decisions. I know most traders seem to think the the more they know the better they'll trade; but, I just want the "important" information, everything else just becomes anecdotal and can lead very quickly to "analysis paralysis". I added your levels to my chart to give you context.
Ok, you have mentioned in private about total volume being part of the CD equation. In order to have a more powerful entry signal ( in your experience) would you prefer to see a CD change on higher total volume than the previous bars in your view or lower volume ? I'm assuming you'd like to see the change on higher volume but I need to ask anyway.
Increasing volume can add momentum to a move. But, it is secondary in mind.
Reply to BruceM-
This will probably come as "no" surprise to you, but the entire concept of divergences when to comes to volume and CD is of very little value in my mind. I know this goes against some "conventional" wisdom but let me explain.
I think that if we knew the exact same buyers and sellers where transacting business at the points of divergences they(divergences) would be of value. Since the entire pool of buyers and sellers and their individual motivations are constantly changing. And, add to that the varying pressures of things like news events and reports, etc. The appearance of divergences are simply "coincidences" of overall market action. And, identifiable only after the fact, like many more "coincidences"(which is another test if something is an "event" or a "coincidence").
I am not saying that trading using "coincidences" is wrong, I'm just trying to show an alternative perception of the market that many might never have considered. I prefer to use verifiable "events" for my trading decisions.
BeyondMP...You mentioned in an email that total volume needs to be incorporated into the CD picture...How can we use that concept with divergences?
This will probably come as "no" surprise to you, but the entire concept of divergences when to comes to volume and CD is of very little value in my mind. I know this goes against some "conventional" wisdom but let me explain.
I think that if we knew the exact same buyers and sellers where transacting business at the points of divergences they(divergences) would be of value. Since the entire pool of buyers and sellers and their individual motivations are constantly changing. And, add to that the varying pressures of things like news events and reports, etc. The appearance of divergences are simply "coincidences" of overall market action. And, identifiable only after the fact, like many more "coincidences"(which is another test if something is an "event" or a "coincidence").
I am not saying that trading using "coincidences" is wrong, I'm just trying to show an alternative perception of the market that many might never have considered. I prefer to use verifiable "events" for my trading decisions.
http://www.mypivots.com/dictionary/definition/56/delta
http://www.mypivots.com/dictionary/definition/648/cumulative-delta-cd
http://www.mypivots.com/dictionary/definition/648/cumulative-delta-cd
sorry abt the confusion, had to create a temporary username since i had forgotten the pwd on this account ! years don't come lightly...all sorted out now
Emini Day Trading /
Daily Notes /
Forecast /
Economic Events /
Search /
Terms and Conditions /
Disclaimer /
Books /
Online Books /
Site Map /
Contact /
Privacy Policy /
Links /
About /
Day Trading Forum /
Investment Calculators /
Pivot Point Calculator /
Market Profile Generator /
Fibonacci Calculator /
Mailing List /
Advertise Here /
Articles /
Financial Terms /
Brokers /
Software /
Holidays /
Stock Split Calendar /
Mortgage Calculator /
Donate
Copyright © 2004-2023, MyPivots. All rights reserved.
Copyright © 2004-2023, MyPivots. All rights reserved.