Cumulative Delta
To help illustrate the usefulness of Cum Delta, I'll post some charts. The first ones will have BruceM zones as reference. Hopefully this will stimulate some discussion and sharing of Cum Delta ideas.
Originally posted by BruceM
So Lorn here is what I have for you so far. Is your primary visual focus the old pivot levels of CD or price? Which is what gets your attention first?
I look at these old pivot levels of CD and price together. I suppose you could say the CD pivot level catches my attention first but they go together. Without price the CD pivot would be meaningless.
You also show on your chart price breaking out of it's Overnight high while CD was still under it's overnight high. So that is a divergence and would get a green box too. Is that correct ?
This is a divergence but not the kind I was pointing out in my chart. This is simple or standard divergence, one that is widely followed by traders and in my view is less important. Its certainly a divergence though.
So do you use any kind of fixed points when snapping your CD lines ? Like the previous real time levels or is it always a constant running chart...hence the name CD...lol?
Not exactly sure what you are asking here. I'm running a constant chart from the beginning of the contract until the next contract takes over.
Originally posted by BruceM
Suppose we see Price make a new high but CD does not. Are there certain amounts of price movement that bigger traders will "allow" the market to go against them before price snaps back ? In this example price would come back down.
I'm sure this can be answered in as many ways as there are trader's. I see traders constantly looking for absolutes so as to tell them when/what to do. I don't believe this is possible and certainly not with CD.
Some times we will see exactly what you are describing here Bruce with only a small price movement or CD movement but every trader knows who has been in this business for any length of time that all these different tools, setups or whatever you want to call them don't work 100% of the time and don't work exactly like every other time they worked.
There is information being broadcast and its the traders job through knowledge, skill and experience to interpret that information and make a trade or not.
I wish I could say that when CD reverses 300 contracts this is telling us price is going to reverse. Its just not the case.
You always use the word context in your commentary Bruce. That is the real secret....and lots of experience and practice to learn and internalize what to do in the context of the day/week/month.
Cheers!
you guys are getting votes and that is an encouraging sign. I'd like to see more comments and questions posted as it seems you both may have different views of CD that could support each other.
Basically so far the difference is that Lorn likes to give some relevance to different swing points of CD where it is my understanding that BeyondMP doesn't think that is of value. I'm respectfully pointing out the differences and is not my intent here to start a debate on the usefulness on any particular idea. It is up to the discretion of us lucky readers to decide which may work with our trading styles.
As per your first post BeyondMP are you planning to post different charts of DIFFERENT ways to use CD ? I ask this because I want to stay on topic but perhaps it would also be beneficial to post different "Events" that compliment the CD data. So I want to keep the thread on track in the direction you want it to go. I think most including myself appreciate any and all visuals as it helps reinforce the ideas being conveyed.
I'm not sure if this is appropriate here but are you planning to discuss the different "events" that you like to use? Are they all derived from the CD data? Very interesting and refreshing to hear that price is not an important visual. Is it safe to say that you don't even need it on your main chart screen ?
And thanks to both of you for answering my questions directly and to the point.
I'm hoping we can generate some broad participation. I certainly don't expect the both of you to keep this alive if it just happens to be 3 or 4 of us involved. Lots of potential here. I hope more can recognize it!
I too am trying to get an understanding of cd. My only reservation is that once again I may not be keeping it simple. I believe we probably spend an inornate amount of time looking for the holy grail, which we probably already posses. The left vs right side of the brain conflict keeps us unsure.
Lorn my question about the levels was based on the posted linked definition which mentions the Cummulative $tick.
Since the $tick only trades during day session hours then it may seem to me that it might be beneficial to know where previous days levels of CD are without the overnight data included. So at least we'd be comparing the same hours with the data.
For example, suppose we rally strong in the overnight session that pushed CD levels up very high. Now when the market opens we would get very different readings if we only use the day session CD.
It just doesn't make sense to me to use NYSE Cummulative $Tick which doesn't include overnight data and try to use the CD which does include the O/N data. It may also be useful to know if only day session CD data is trying to push a market higher or lower than previous days levels. So it may be useful to know where those levels are. Just curious on your thoughts.
Gheesh! Does that question make sense ? Sometimes the inability for me to explain what I'm thinking just kills me !!! LOL!!
Originally posted by BruceM
Lorn my question about the levels was based on the posted linked definition which mentions the Cummulative $tick.
Since the $tick only trades during day session hours then it may seem to me that it might be beneficial to know where previous days levels of CD are without the overnight data included. So at least we'd be comparing the same hours with the data.
Bruce I don't compare cumulative TICK levels with CD levels. TICK for me has more to do with context of the overall day then what specific CD levels are doing.
Originally posted by BruceM
Basically so far the difference is that Lorn likes to give some relevance to different swing points of CD where it is my understanding that BeyondMP doesn't think that is of value.
The reason these swing points are used is to find areas for us to do business. After trading using these areas, the astute trader realizes sometimes they work and sometimes they don't. If you understand that all price movement is a product of the interaction between buyers and sellers, you come to the thought "Will being able to evaluate buying and selling "pressure"(CD) help increase my profitability?"
After watching this interaction or "CD" for a while you realize that when CD is increasing the chance of a "shorts" success is greatly diminished and a "longs" success is enhanced, etc. You then come to the thought, "If the "CD" is vital to the success of the level, why use the level at all? If I'm only going to take trades when CD is in my favor, I'll just trade with it." So, it isn't a question of value, it is one of simplification.
Originally posted by BruceM
It may also be useful to know if only day session CD data is trying to push a market higher or lower than previous days levels. So it may be useful to know where those levels are. Just curious on your thoughts.
I like to see all volume but I certainly understand what you are suggesting here and wouldn't discount it if a trader wanted to follow it separately.
Originally posted by BruceM
I'm not sure if this is appropriate here but are you planning to discuss the different "events" that you like to use? Are they all derived from the CD data? Very interesting and refreshing to hear that price is not an important visual. Is it safe to say that you don't even need it on your main chart screen ?
There are 2 other separate "events" I use in my trading of the "ES", unrelated to CD, but important to me. As this is meant to be a discussion of CD and its usefulness, I don't think they would be of value here.
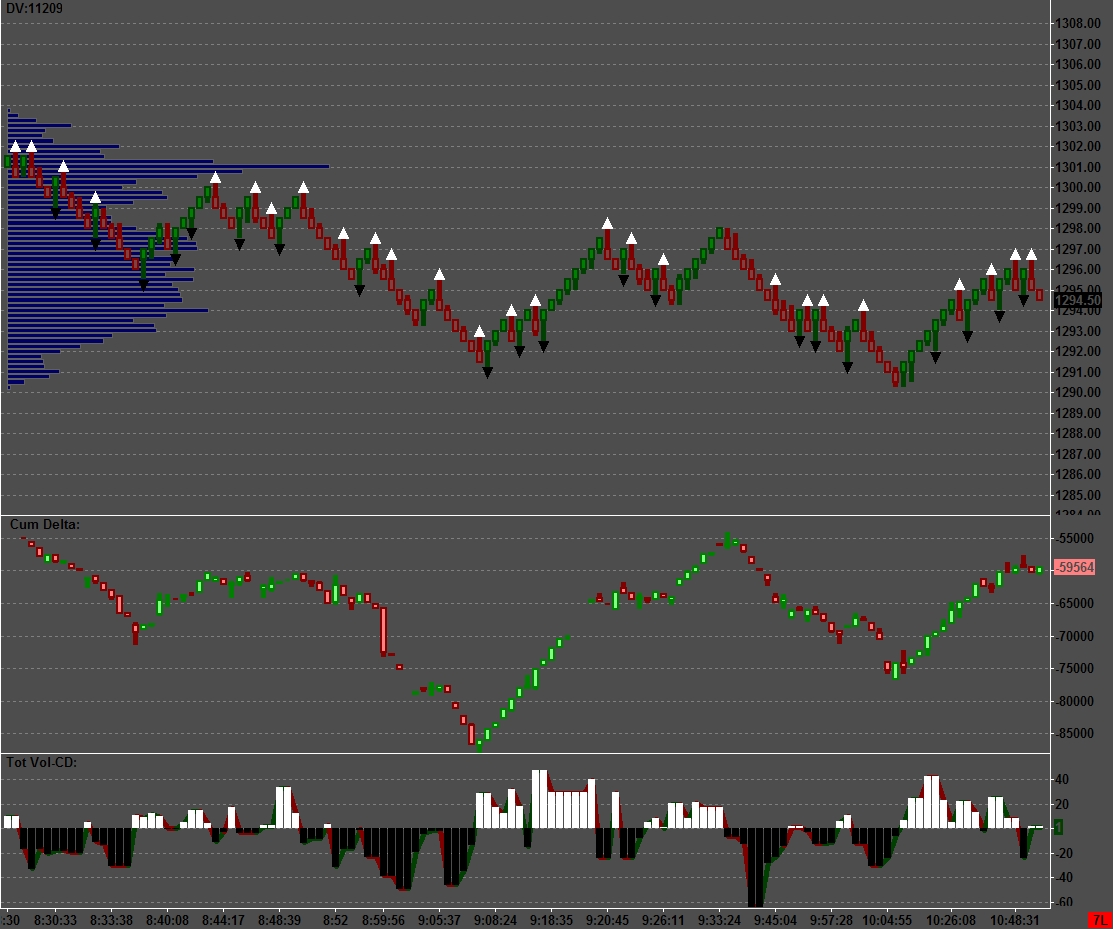
There is another metric to CD, I find useful. It is an evaluation of CD against total volume. It helps me to see the "true" direction of CD. It actually comes from a seperate chart but for purposes of illustration I've added to the "renko' chart.
I need price on the main chart to see the price for my entry, but it is not needed for any of CD calculations. Price based indicators are of no value, in my concept of how the markets operate.
Click image for original size
The difference in CD using a price based vs. time based charts can be very interesting. This shows the coincidence of differing formations depending solely on chart settings. Based on Friday's ES discussion.
(price based on the left-time based on the right)
(price based on the left-time based on the right)
Click image for original size

sorry abt the confusion, had to create a temporary username since i had forgotten the pwd on this account ! years don't come lightly...all sorted out now
Emini Day Trading /
Daily Notes /
Forecast /
Economic Events /
Search /
Terms and Conditions /
Disclaimer /
Books /
Online Books /
Site Map /
Contact /
Privacy Policy /
Links /
About /
Day Trading Forum /
Investment Calculators /
Pivot Point Calculator /
Market Profile Generator /
Fibonacci Calculator /
Mailing List /
Advertise Here /
Articles /
Financial Terms /
Brokers /
Software /
Holidays /
Stock Split Calendar /
Mortgage Calculator /
Donate
Copyright © 2004-2023, MyPivots. All rights reserved.
Copyright © 2004-2023, MyPivots. All rights reserved.