ES 4-27-2011
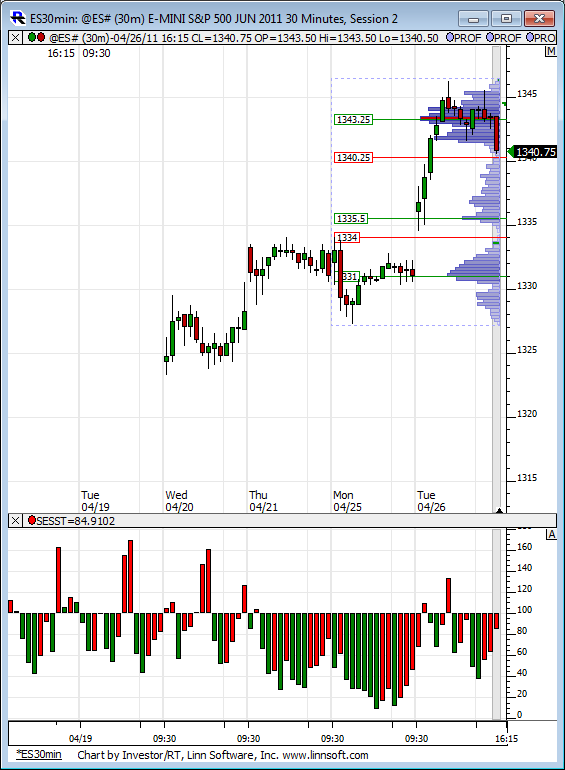
Here is a 30-min chart with the developing profile for the week. On the lower pane I have a relative volume study giving feedback for the past 200 trading days. Quite interesting the rally over the last week has come on some seriously weak volume in relative terms to the last 200 days of trading.
Notice the one bar from todays session which is about 130% above normal 200 day volume, that came on the high reversal bar for the day...
Notice the one bar from todays session which is about 130% above normal 200 day volume, that came on the high reversal bar for the day...
Click image for original size
Struggle
Click image for original size
LisaP,
thanks for posting chart.
I have a question,
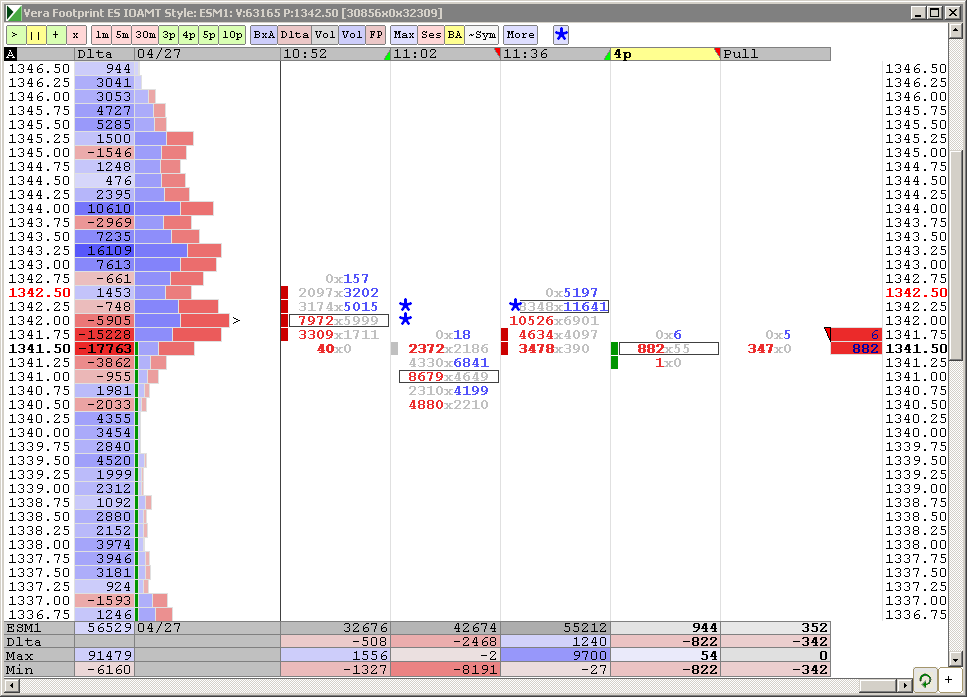
what is the definition of the footprint you are showing. I look at timestamps at top of chart and 10:52 and 11:02 (I think I did anyway)
are you showing footprints based on 10minute time periods?
thanks for posting chart.
I have a question,
what is the definition of the footprint you are showing. I look at timestamps at top of chart and 10:52 and 11:02 (I think I did anyway)
are you showing footprints based on 10minute time periods?
Originally posted by PAUL9
LisaP,
thanks for posting chart.
I have a question,
what is the definition of the footprint you are showing. I look at timestamps at top of chart and 10:52 and 11:02 (I think I did anyway)
are you showing footprints based on 10minute time periods?
Paul, my chart is a "point and figure" type, which is NOT time-based. New column is started when when price goes 5 tics agains the move. The time on the top of the column is when a new column starts.
Lisa,
thanks alot.
I thought I was living in the twilight zone, none of anything I was doing was coming close to what you had posted.
now, with your explanation I understand the chart.
(although this realization does not necessarilly mean that I do not have a permanent residence in.... the twilight zone)
- cue theme music...
Thanks Lorn...lol
terrific, Lorn
perfect
thanks alot.
I really appreciated that.
and you know what?
I can make a substitute for "twilight" at the very end of the clip, .
"Trader"
perfect
thanks alot.
I really appreciated that.
and you know what?
I can make a substitute for "twilight" at the very end of the clip, .
"Trader"
Click image for original size
INDU=12,700
Last chart for today...lol
Click image for original size
Emini Day Trading /
Daily Notes /
Forecast /
Economic Events /
Search /
Terms and Conditions /
Disclaimer /
Books /
Online Books /
Site Map /
Contact /
Privacy Policy /
Links /
About /
Day Trading Forum /
Investment Calculators /
Pivot Point Calculator /
Market Profile Generator /
Fibonacci Calculator /
Mailing List /
Advertise Here /
Articles /
Financial Terms /
Brokers /
Software /
Holidays /
Stock Split Calendar /
Mortgage Calculator /
Donate
Copyright © 2004-2023, MyPivots. All rights reserved.
Copyright © 2004-2023, MyPivots. All rights reserved.