ES 4-27-2011
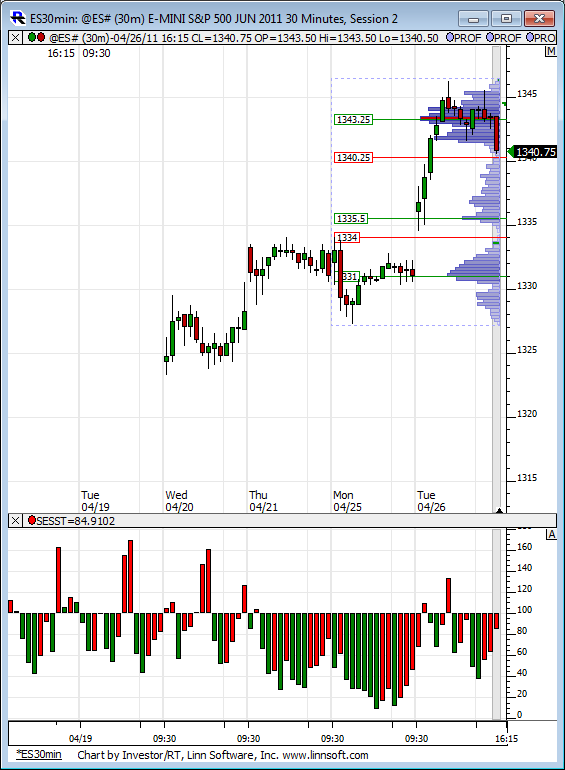
Here is a 30-min chart with the developing profile for the week. On the lower pane I have a relative volume study giving feedback for the past 200 trading days. Quite interesting the rally over the last week has come on some seriously weak volume in relative terms to the last 200 days of trading.
Notice the one bar from todays session which is about 130% above normal 200 day volume, that came on the high reversal bar for the day...
Notice the one bar from todays session which is about 130% above normal 200 day volume, that came on the high reversal bar for the day...
Click image for original size
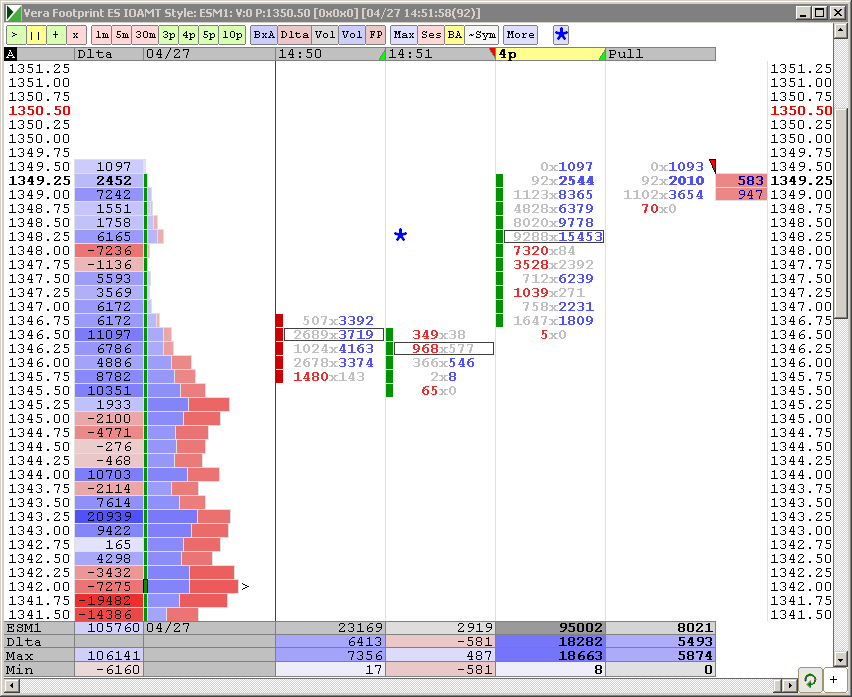
while TICK below 600 - weird
Levels for tomorrow.
Click image for original size
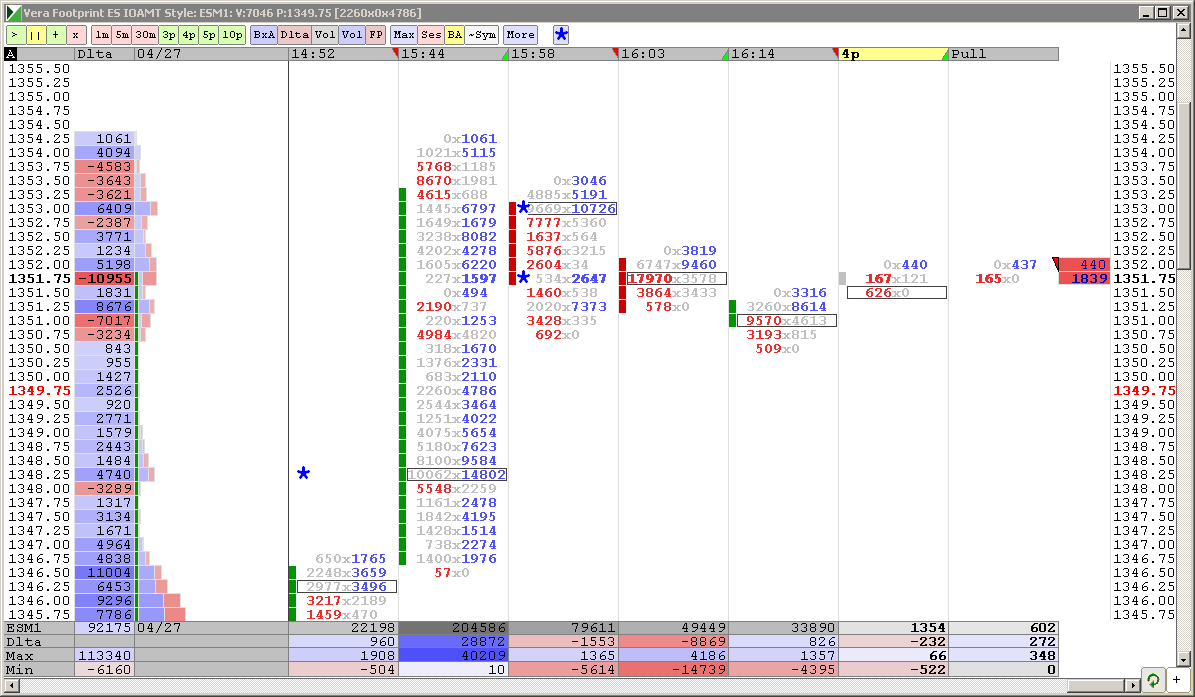
Last chart for today...lol
Click image for original size
Emini Day Trading /
Daily Notes /
Forecast /
Economic Events /
Search /
Terms and Conditions /
Disclaimer /
Books /
Online Books /
Site Map /
Contact /
Privacy Policy /
Links /
About /
Day Trading Forum /
Investment Calculators /
Pivot Point Calculator /
Market Profile Generator /
Fibonacci Calculator /
Mailing List /
Advertise Here /
Articles /
Financial Terms /
Brokers /
Software /
Holidays /
Stock Split Calendar /
Mortgage Calculator /
Donate
Copyright © 2004-2023, MyPivots. All rights reserved.
Copyright © 2004-2023, MyPivots. All rights reserved.