ES Monkey MAP for 5-4-11
Here's my 30min MAP of 20 trading days that I've got with the Red lines as potential PASR levels with Magenta as semi-significant. The White dashed lines are Weekly Pivots. The Gray background is "overnight trading" and the Light Blue bars on the right vertical axis represent Volume at Price. Hope this is helpful to some folks!
Click image for original size

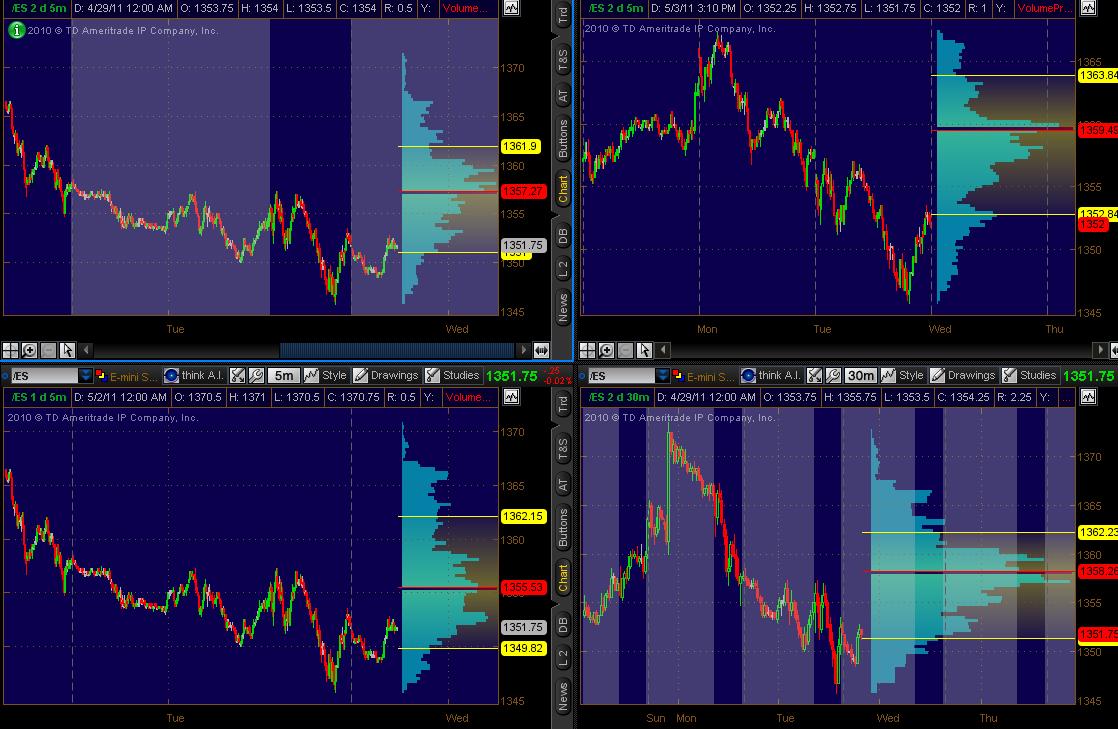
And some ES Volume Profile charts:
Top Left: 5min chart of 2 days data ATH
Top Right: 5min chart of 2 days data RTH
Bottom Left: 5min chart of 1 days data ATH
Bottom Right: 30min chart of 2 days data ATH
Top Left: 5min chart of 2 days data ATH
Top Right: 5min chart of 2 days data RTH
Bottom Left: 5min chart of 1 days data ATH
Bottom Right: 30min chart of 2 days data ATH
Click image for original size
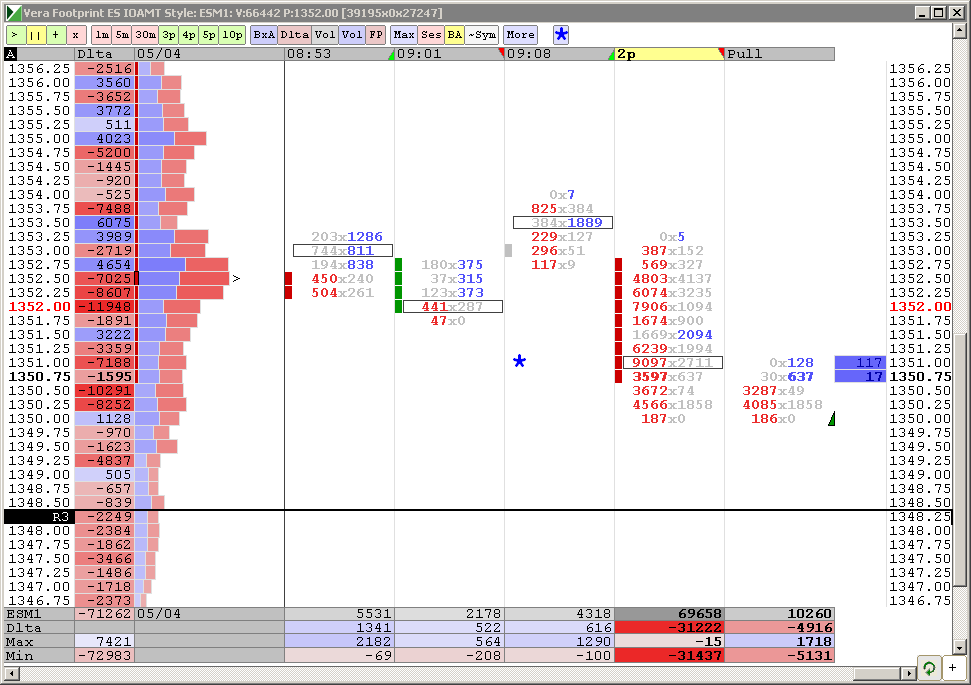
1352.50 and 1355 are the top key areas...still in play is the 45 -47 on the downside

Good morning all
Click image for original size
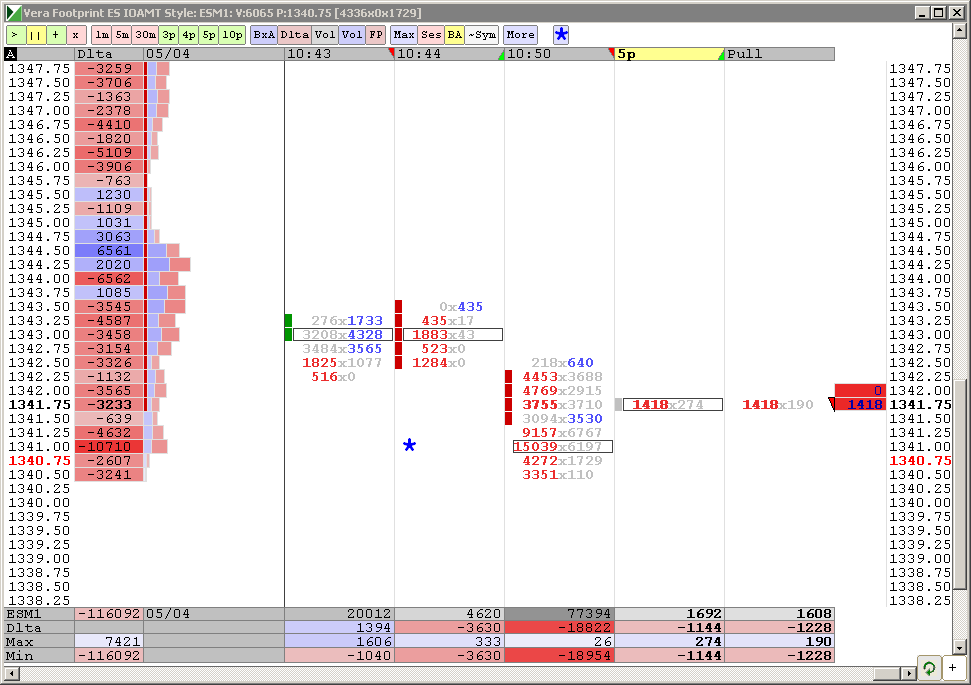
number at 41.50 is my long trade...
covered runners at 44.25.....was watching that 45 - 47 zone....back to bed for me.....not up to snuff the last few days...good luck today
Click image for original size
Emini Day Trading /
Daily Notes /
Forecast /
Economic Events /
Search /
Terms and Conditions /
Disclaimer /
Books /
Online Books /
Site Map /
Contact /
Privacy Policy /
Links /
About /
Day Trading Forum /
Investment Calculators /
Pivot Point Calculator /
Market Profile Generator /
Fibonacci Calculator /
Mailing List /
Advertise Here /
Articles /
Financial Terms /
Brokers /
Software /
Holidays /
Stock Split Calendar /
Mortgage Calculator /
Donate
Copyright © 2004-2023, MyPivots. All rights reserved.
Copyright © 2004-2023, MyPivots. All rights reserved.