ES 5-12-2011
Developing RTH volume profile for the week. Notice relative volume on the bottom increases as prices drop and decreases as prices rebound. The profile itself is interesting, kind of like clumps with not much in between.
Click image for original size
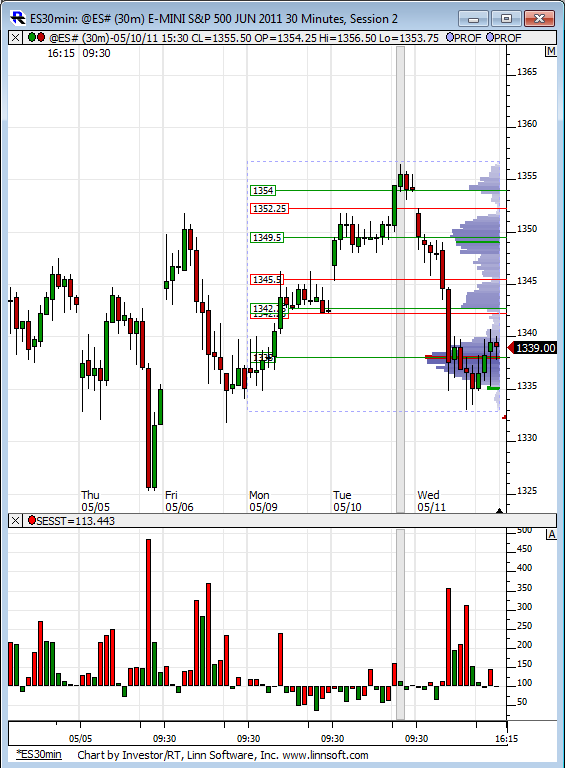
Lorn chart shows that nice symetric distribution in the 1335 - 1340 range from Yesterday. Peak volume is in the middle (1337.50)so it will take volume to drive away from that. The basic idea is to trade for a retest of 1337.50.
My prefered plan is to look for buys under 1333 or sells above the 40 area....40 - 44 is a low volume area and price left single prints in there.......so fading above the 40 needs to be done more carefully because if we are wrong they can move the market back through there quickly to go back up into 1344...I'm not prepared to handle 4 points of pain if I was short near 1340
My prefered plan is to look for buys under 1333 or sells above the 40 area....40 - 44 is a low volume area and price left single prints in there.......so fading above the 40 needs to be done more carefully because if we are wrong they can move the market back through there quickly to go back up into 1344...I'm not prepared to handle 4 points of pain if I was short near 1340
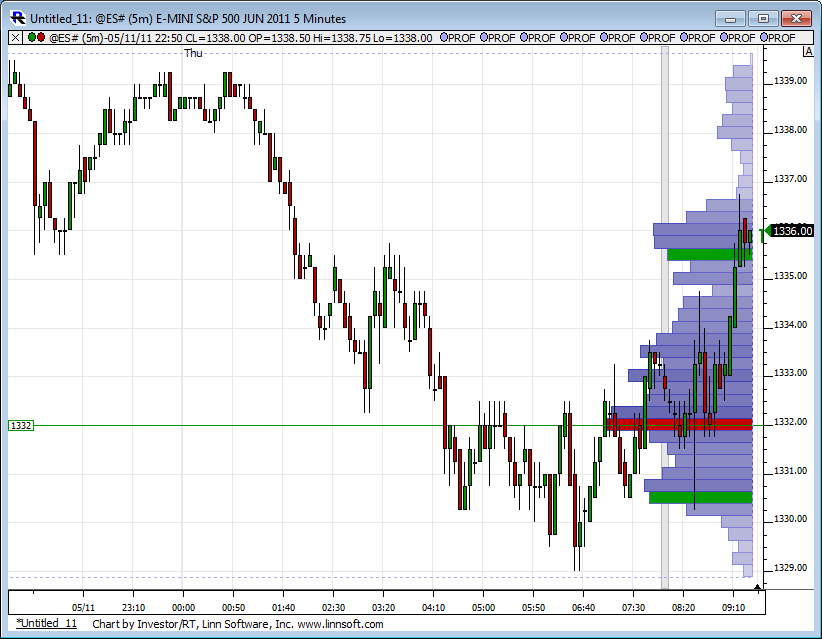
Small long at 32.25.......this is a rough area as peak volume from O/N is at the same exact price......so there is nothing to say that they won't keep bring it back to 1332...
this is small so first target is 1335 and then will try to hold 1 measly contract
I don't expect a "royal flush" like yesterdays open and drive down...that would be unusual..expect some good two sided trade early on
this is small so first target is 1335 and then will try to hold 1 measly contract
I don't expect a "royal flush" like yesterdays open and drive down...that would be unusual..expect some good two sided trade early on
Nice trade Bruce.
Daniel
Daniel
thanks ..hopefully the logic is coming through so you can see WHY I took that
O/N Profile. Gives a good indication from the build up of volume between 1330-1333 as to why Bruce took his trade.
Click image for original size
starting at 31.75 on longs in RTH...higher risk as 36 - 37.50 has already been tested and we know they like to run O/N highs and lows.....and low is close by
Thanks for the explanation! What size stop do you have on a trade like that? (if you don't mind me asking)
Daniel
Daniel
adding at 28.75....31.75 is target
With you at 29.75.
I don't use hard stops Daniel and will add into trades...I tend to start out light and add bigger at key points.....Some may look at it as adding to a loser and you can argue it both ways but I look at an overall dollar risk per campaign.....as long as you stay true to your maximum pain level/drawdown then it is ok...
I'm just not good enough to call tops and bottoms consistently so I work from an overall concept of what I EXPECT to happen.....when expectations aren't met then we lose money...So I was expecting two sided trade and really thought that a drive lower was gonna be the fake out...so I start out small and add on lower trade
That O/N disstribution Lorn showed is the same concept as the day session symetric distribution....When we can't hold volume on a push away... we will revert back
I had a feeling my 31's were initiated at a bad spot...as that was again right near the peak volume node.....it was safer to wait for a drive away and trade for mean reversion....The O/N range is a key range to watch
Like with most sup/res, they aren't always exact. Sometimes it comes in a little short and looks like a 50%, sometimes it goes a little long and gets closer to the 61.8%. But in all, I feel more comfortable with the 52.8.
BUT, you have to make sure you are measuring from the right direction. 52.8 in one direction is the 47.2 in the other direction. Using today's data, measuring from the PP up to R1, you see support at that 52.8 level. If I had measured from R1 to PP, then the level would be too high.

I have a script that auto-calcs the fib levels between the pivot levels. For example, if I double click in between PP and R1 (but closer to R1) then the levels are calculated originating from R1. If I click closer to PP, then they are outputted originating from PP, etc. Great time saver.
Can you expand more on what you mean about "combining momentum with the pivots"?
Daniel
BUT, you have to make sure you are measuring from the right direction. 52.8 in one direction is the 47.2 in the other direction. Using today's data, measuring from the PP up to R1, you see support at that 52.8 level. If I had measured from R1 to PP, then the level would be too high.
I have a script that auto-calcs the fib levels between the pivot levels. For example, if I double click in between PP and R1 (but closer to R1) then the levels are calculated originating from R1. If I click closer to PP, then they are outputted originating from PP, etc. Great time saver.
Can you expand more on what you mean about "combining momentum with the pivots"?
Daniel
Originally posted by grednfer
Neo....
Its good to hear someone from the pivot site actually uses these thingees.......I have an algo background....and have only recently incorporated a pivots (go figure right?).....I really like it.....Simple, easy to calc and visualize and TEST!, yet dynamic.....
I've haven't tried the 52% factor, but I use 50% just like another pivot.......it pops up alot.
Like tonight....NQ AH top is 2308=((R1-PP)*.5)+PP......its works alot....
I really like combining momentum with the pivots....but I have to adjust the numbers so I get movement through the pivot....I haven't perfected that yet(need more data).....Its just a fixed adjustment....on ES it seems to be 1.5-2 points....
Very Cool.....
Emini Day Trading /
Daily Notes /
Forecast /
Economic Events /
Search /
Terms and Conditions /
Disclaimer /
Books /
Online Books /
Site Map /
Contact /
Privacy Policy /
Links /
About /
Day Trading Forum /
Investment Calculators /
Pivot Point Calculator /
Market Profile Generator /
Fibonacci Calculator /
Mailing List /
Advertise Here /
Articles /
Financial Terms /
Brokers /
Software /
Holidays /
Stock Split Calendar /
Mortgage Calculator /
Donate
Copyright © 2004-2023, MyPivots. All rights reserved.
Copyright © 2004-2023, MyPivots. All rights reserved.