ES 5-12-2011
Developing RTH volume profile for the week. Notice relative volume on the bottom increases as prices drop and decreases as prices rebound. The profile itself is interesting, kind of like clumps with not much in between.
Click image for original size
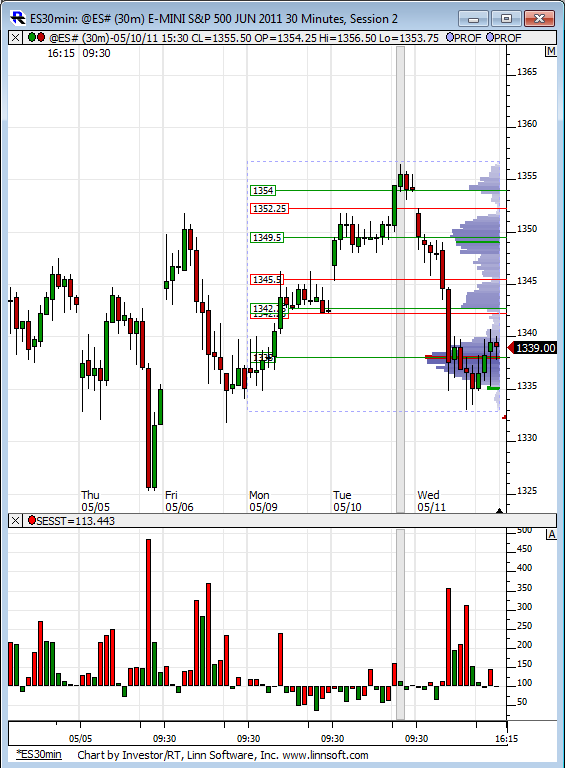
Just an FYI, I personally use pivot levels a lot. I also focus on two fib levels in between each pair of pivot levels, the 52.8% and the 78.6%.
The high so far, 1348.75, was exactly 52.8% between PP and R1.
This morning, the 1336.25 area was strong resistance a couple times that eventually turned into support. 1336.25 was exactly 52.8% from S1 to the PP.
Just thought I'd share...
Daniel
The high so far, 1348.75, was exactly 52.8% between PP and R1.
This morning, the 1336.25 area was strong resistance a couple times that eventually turned into support. 1336.25 was exactly 52.8% from S1 to the PP.
Just thought I'd share...
Daniel
Here is a screen shot to illustrate my last post:

sorry my wife hijacked the laptop I post from....I haven't seen triples today...the 48.75 coincided with the peak volume price BEFORE it flipped yesterday at 48....a good fade there...still liking fades as long as the 48 number holds...
45.50 is peak volume from todays session so far
45.50 is peak volume from todays session so far
Thanks for sharing that!
Originally posted by neoikon
Just an FYI, I personally use pivot levels a lot. I also focus on two fib levels in between each pair of pivot levels, the 52.8% and the 78.6%.
The high so far, 1348.75, was exactly 52.8% between PP and R1.
This morning, the 1336.25 area was strong resistance a couple times that eventually turned into support. 1336.25 was exactly 52.8% from S1 to the PP.
Just thought I'd share...
Daniel
where does 52.8 come from ?
Thanks neoikon Interesting levels produced
Originally posted by Silverharp
where does 52.8 come from ?
Glad you asked!
The short answer:
It is 61.8% of the distance between 38.2% and 61.8%.
The long answer:
I've recently done a lot of playing around with Fibonacci in order to better understand where all these "common" fib numbers (0.236, 0.382, 0.618, 0.786, etc) come from and what they really mean. What sparked my research was that people rely heavily on "50%" or "half way back", BUT this doesn't fit in the world of the "golden mean" or the "golden ratio" so it never felt right to me.
If you haven't heard of the "golden ratio", it's really quite interesting: http://en.wikipedia.org/wiki/Golden_ratio
The quick gist of 52.8% it is if you take 0.618 of a range, then take 0.618 of the range that's left, you get 0.382. If you then take 0.618 of the 0.618 level and the 0.382 level, you have 0.528. So, if we are going to use fib numbers, which are centered around the golden ratio, it makes sense to me to use 52.8% rather than 50%.
Basically, I've determined that 0.618 is all that matters (and 0.618 of smaller segments). All the other fib numbers are merely short-hand to get to 0.618 of a smaller segment.
I actually wrote of up blog entry to help describe it, if you're interested:
http://neotoolbox.com/blog/post/2011/03/07/20110307-Fibonacci-Level-Breakdown-and-a-Case-for-52825.aspx
Enjoy!
Daniel
Fascinating Daniel. Thanks very much for sharing that. I've been a 50%'er forever, but have known all along that it is not a true Fib #. For me it fit into the, "if everyone one believes it, it must be true" catagory. In other words a self fulfilling prophecy. Hey whatever works.
Now, however, I will look at your 52% number more closely.
Now, however, I will look at your 52% number more closely.
Neo....
Its good to hear someone from the pivot site actually uses these thingees.......I have an algo background....and have only recently incorporated a pivots (go figure right?).....I really like it.....Simple, easy to calc and visualize and TEST!, yet dynamic.....
I've haven't tried the 52% factor, but I use 50% just like another pivot.......it pops up alot.
Like tonight....NQ AH top is 2308=((R1-PP)*.5)+PP......its works alot....
I really like combining momentum with the pivots....but I have to adjust the numbers so I get movement through the pivot....I haven't perfected that yet(need more data).....Its just a fixed adjustment....on ES it seems to be 1.5-2 points....
Very Cool.....
Like with most sup/res, they aren't always exact. Sometimes it comes in a little short and looks like a 50%, sometimes it goes a little long and gets closer to the 61.8%. But in all, I feel more comfortable with the 52.8.
BUT, you have to make sure you are measuring from the right direction. 52.8 in one direction is the 47.2 in the other direction. Using today's data, measuring from the PP up to R1, you see support at that 52.8 level. If I had measured from R1 to PP, then the level would be too high.

I have a script that auto-calcs the fib levels between the pivot levels. For example, if I double click in between PP and R1 (but closer to R1) then the levels are calculated originating from R1. If I click closer to PP, then they are outputted originating from PP, etc. Great time saver.
Can you expand more on what you mean about "combining momentum with the pivots"?
Daniel
BUT, you have to make sure you are measuring from the right direction. 52.8 in one direction is the 47.2 in the other direction. Using today's data, measuring from the PP up to R1, you see support at that 52.8 level. If I had measured from R1 to PP, then the level would be too high.
I have a script that auto-calcs the fib levels between the pivot levels. For example, if I double click in between PP and R1 (but closer to R1) then the levels are calculated originating from R1. If I click closer to PP, then they are outputted originating from PP, etc. Great time saver.
Can you expand more on what you mean about "combining momentum with the pivots"?
Daniel
Originally posted by grednfer
Neo....
Its good to hear someone from the pivot site actually uses these thingees.......I have an algo background....and have only recently incorporated a pivots (go figure right?).....I really like it.....Simple, easy to calc and visualize and TEST!, yet dynamic.....
I've haven't tried the 52% factor, but I use 50% just like another pivot.......it pops up alot.
Like tonight....NQ AH top is 2308=((R1-PP)*.5)+PP......its works alot....
I really like combining momentum with the pivots....but I have to adjust the numbers so I get movement through the pivot....I haven't perfected that yet(need more data).....Its just a fixed adjustment....on ES it seems to be 1.5-2 points....
Very Cool.....
Emini Day Trading /
Daily Notes /
Forecast /
Economic Events /
Search /
Terms and Conditions /
Disclaimer /
Books /
Online Books /
Site Map /
Contact /
Privacy Policy /
Links /
About /
Day Trading Forum /
Investment Calculators /
Pivot Point Calculator /
Market Profile Generator /
Fibonacci Calculator /
Mailing List /
Advertise Here /
Articles /
Financial Terms /
Brokers /
Software /
Holidays /
Stock Split Calendar /
Mortgage Calculator /
Donate
Copyright © 2004-2023, MyPivots. All rights reserved.
Copyright © 2004-2023, MyPivots. All rights reserved.