YMM1, (3, -1), profitable strategy, Stretch 16 May
Hi,
16 May
The 'fade the first move by 1.618% of the Stretch calculation and project a price measurement that is three Stretch calculations' ... higher was profitable 16 May.
Trading from unchanged, 12556, Stretch =37, 1.618% of the Stretch = 59
12556 - 59 = 12497
12497 + 37 + 37 + 37 = 12608
Successful: +111 points basis YMM1
first trade with Hunters method successful:
Long @12497
Close @12608
profit +111.
Profit: $555
largest drawdown: 8 points
reward : risk ratio: 6.3 : 1
largest possible reward: 114 points, i.e., exit three points from the high. YMM1 prices then fell 1.618% (59 points) to unchanged.
H,
Your thing is working again today......
Short from 556.....on YM
Went long then short NQ, now long again...(Pushing my luck though, maybe)
Working on ES as well.....but they are not completely in sync.
-A couple of observations
-I think 98% accuracy on the numbers is a good expectation. Still trying to decide on the math tolerance........
-As ALWAYS, should be sensitive to the trend, whish just means shorts work better in descending market and longs in uptrend. Which is not to say that counter-trending won't work, because it is.
-Should be sensitive to other constraints such as MAs and trendlines.
But generally the 1,3 approach is defining good tradeable waves.
Very Cool....Thx
Ayn, I didnt trade S1 , I took the SPX trade , got stopped out then saw the 423 on the dow at 12352 and took it., I also had a 161 on USDCAD so took it too. closed the Dow and USDCAD still open. The way I look at it if I'm fighting the trend I'm only taking selected bites, I bet a lot of buy dippers got burned today. As it is I'll have a profit or flat worst case, if everything turns around again.
you wrote this on the other thread "the 1318.3 number I had could be in play? DX didnt make a new high with the low. Dow is odd today much heavier downside , stopped at S1"...i meant what was the entry level of the trade that got stopped at S1...
the 4.23 on the dow looked dow, because it coincided with some support on es as well...i think both charts have to be looked at to decide an entry
i bot 317 on es, 1 point below the 1.618 where i had a lot of fib projections (both short, medium and long term) so i suspected it might pierce through that 1.618 momentarily.
other than that paper traded 6e last night, bot the -1x the stretch and unwound it at settlement
thanks for the update
Originally posted by Silverharp
Ayn, I didnt trade S1 , I took the SPX trade , got stopped out then saw the 423 on the dow at 12352 and took it., I also had a 161 on USDCAD so took it too. closed the Dow and USDCAD still open. The way I look at it if I'm fighting the trend I'm only taking selected bites, I bet a lot of buy dippers got burned today. As it is I'll have a profit or flat worst case, if everything turns around again.
here was my chart, we had the stretch buy low last night, I was tempted to go short at the high but wasnt as close to the stretch number as I would have liked. I like an error of 4 points max 6
feel free to discuss if anyone is using a higher tolerence in the numbers, but 4 to 6 seems to work most of the time
feel free to discuss if anyone is using a higher tolerence in the numbers, but 4 to 6 seems to work most of the time
Click image for original size

thanks....what is the dotted green line on your chart?
btw, from what i have seen 4-6 pts seems fair but may be hunter wants to chip in on this
btw, from what i have seen 4-6 pts seems fair but may be hunter wants to chip in on this
the dotted green is S1 , the solid green was S2 , when I was posting earlier I should have said S2 (I think) instead of S1
my s1 and s2 levels are materially different than yours...i have s1 at 12462 and s2 at 12415...
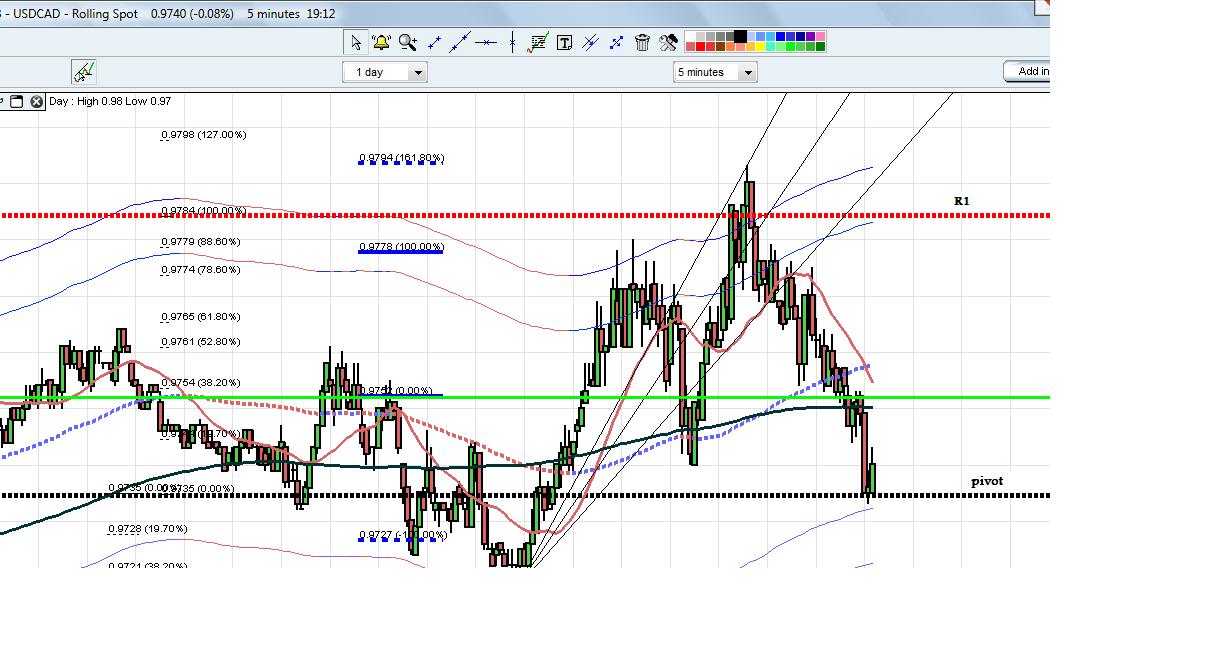
here was my CAD trade off the 161, felt better at the time, closed now
Click image for original size
Hi,
Ayn, ... Basis trading YMM1 from unchanged, 12509, the 4.25% of the Stretch calculation, i.e., -157, (unchanged - 157 = 12509 - 157 = 12352 (12350 = low) reversed two points above the low.
Also, fading the first 1.618% of the Stretch (59 points) price move, i.e., up (12509 + 59 = 12568, ... 12562 = high) was six points beyond the high 12562. YMM1 prices declined 212 points from that high print. I sold that attempt at the 1.618% of the Stretch.
Silverharp, ... thanks for sharing your posts. Are your references to Fibonacci levels based on price levels? or Fibonacci of the Stretch ratios?
Hunter, thanks, the Blue lines are the stretch, the other Fibs I had are just a test based on Neo's idea of having fib ratios between the pivot and the R/S lines. My observation of the past few days wrt the currencies are that they work well on EUR USD CAD pairs, DX didnt get any hits today but getting a hit on two pairs at the same time is good confiration, also useful for gussing at a turn for equities.
Ayn, interesting that you are getting different R/S numbers off the pivot. I've just used the default settings, will have a look and see what the variables are.
Ayn, interesting that you are getting different R/S numbers off the pivot. I've just used the default settings, will have a look and see what the variables are.
thanks hunter
Originally posted by Hunter
Hi,
Ayn, ... Basis trading YMM1 from unchanged, 12509, the 4.25% of the Stretch calculation, i.e., -157, (unchanged - 157 = 12509 - 157 = 12352 (12350 = low) reversed two points above the low.
Also, fading the first 1.618% of the Stretch (59 points) price move, i.e., up (12509 + 59 = 12568, ... 12562 = high) was six points beyond the high 12562. YMM1 prices declined 212 points from that high print. I sold that attempt at the 1.618% of the Stretch.
Silverharp, ... thanks for sharing your posts. Are your references to Fibonacci levels based on price levels? or Fibonacci of the Stretch ratios?
Emini Day Trading /
Daily Notes /
Forecast /
Economic Events /
Search /
Terms and Conditions /
Disclaimer /
Books /
Online Books /
Site Map /
Contact /
Privacy Policy /
Links /
About /
Day Trading Forum /
Investment Calculators /
Pivot Point Calculator /
Market Profile Generator /
Fibonacci Calculator /
Mailing List /
Advertise Here /
Articles /
Financial Terms /
Brokers /
Software /
Holidays /
Stock Split Calendar /
Mortgage Calculator /
Donate
Copyright © 2004-2023, MyPivots. All rights reserved.
Copyright © 2004-2023, MyPivots. All rights reserved.