ES 5-18-2011
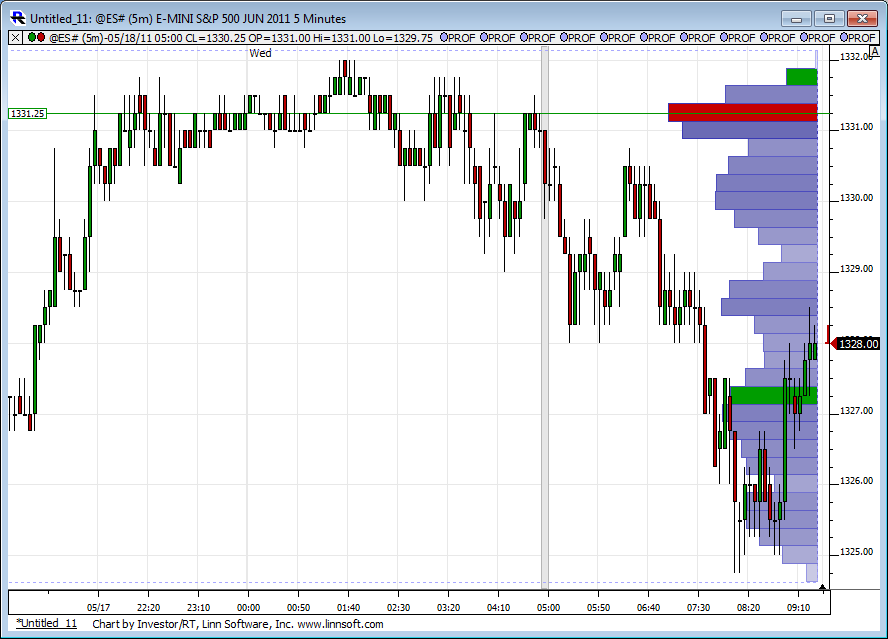
selling into 29.50 area and 31 area ...those are low and high volume areas...target is back to 27.50 ...$ticks still weak but will they stay that way ???
Found support on the PP and the Low of 2 days ago.
FOMC Minutes today at 1pm CST. Expecting that to make this a sideways morning.
obvious inflection points are Yesterdays RTh high and that overnight high.....critical if bulls are to take my money today
no reports at 10 which in theory is good for this fade...only concern so far is that the negative $tick reading aren't really inspiring selling yet.....
ok , filled at target but will 2 runners get any "LOVE" ?
ok , filled at target but will 2 runners get any "LOVE" ?
Nice Bruce!
Lorns chart showed that nice little low volume spot for those looking for reference......that was just above yesterdays RTH highs too....
Tricky spot as they tested and rallied above On low but so far are failing at YD highs ...I'm not the only one who is confused !!
Better sells will be up near 1331 if it comes...
runners stopped at 28.75
Tricky spot as they tested and rallied above On low but so far are failing at YD highs ...I'm not the only one who is confused !!
Better sells will be up near 1331 if it comes...
runners stopped at 28.75
shorting into 30.50...I may be early
concern here is the obvious ..trade is above YD highs and the open and the VA highs from yesterday/......so the only thing left is that O/N high and all the volume up here
Originally posted by BruceM
it seems to me that the real key to all this footprint stuff is figuring out when heavy ask volume is REALLY buying and when heavy bid volume is REALLY selling.....
It seems to lack a filter to really help us figure that crucial question out..
I see heavy Bid volume at 34.75 but it is not selling off...but by the time you figure that out the market is 1.75 - 2 points higher...
Bruce, it is a bitch! Tha is what trading long at resistance is like.
But I am not going to write another long answer. Skype me...lol.
Emini Day Trading /
Daily Notes /
Forecast /
Economic Events /
Search /
Terms and Conditions /
Disclaimer /
Books /
Online Books /
Site Map /
Contact /
Privacy Policy /
Links /
About /
Day Trading Forum /
Investment Calculators /
Pivot Point Calculator /
Market Profile Generator /
Fibonacci Calculator /
Mailing List /
Advertise Here /
Articles /
Financial Terms /
Brokers /
Software /
Holidays /
Stock Split Calendar /
Mortgage Calculator /
Donate
Copyright © 2004-2023, MyPivots. All rights reserved.
Copyright © 2004-2023, MyPivots. All rights reserved.