ES Day Trading 5-23-2011
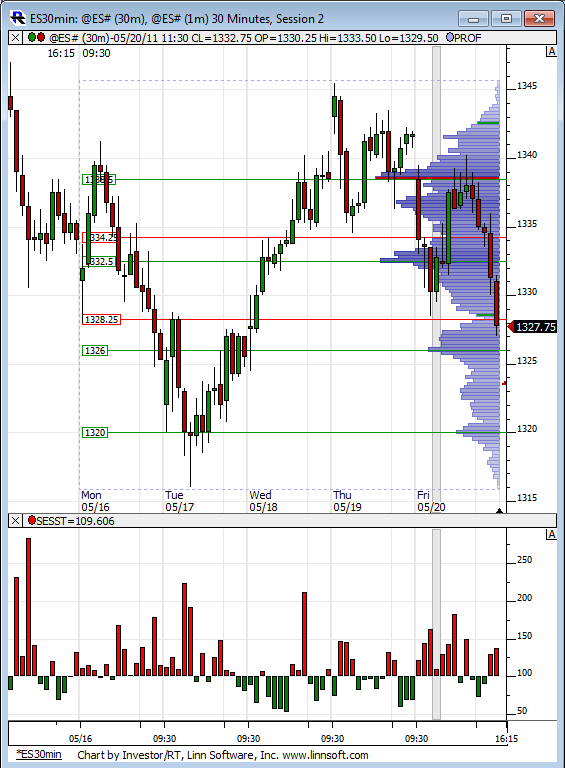
Volume Profile for last weeks RTH action. Not much volume relatively speaking at the bottom of the range.
Click image for original size
Hi, Bruce
Sure, I'll bite.
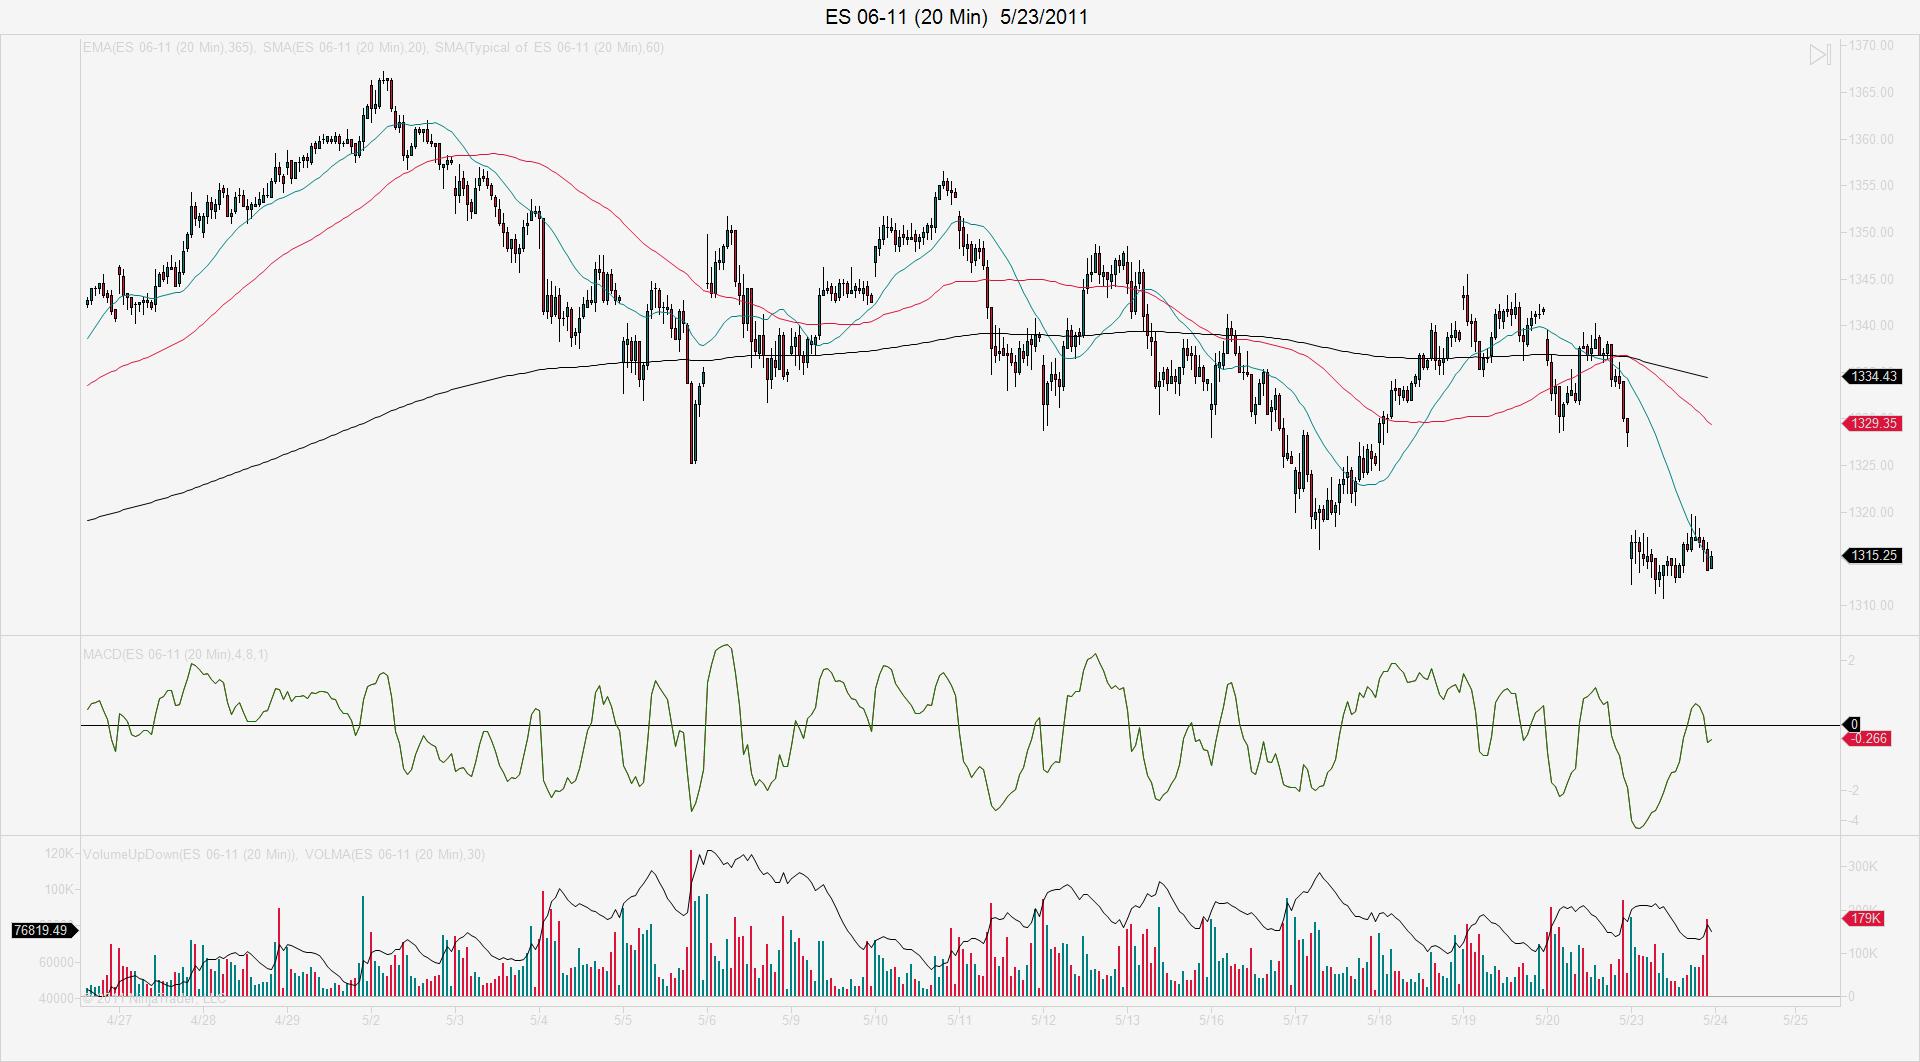
I follow a chain of MA's in varying time-frames with numbers manipulated to coincide with daily numbers. The equivalent of a 3 day typical MA, in my 20 chart, assumed by the equivalent of the 1 day MA. I noticed it first in a series longs to retest. MA crossovers, &ct., but the way I have my charts you can see if prices are rejecting by not hitting the .25%'s. in consolidating periods. And if they do, I stay the position until lower MA's ride above the 55 for a spell. Then the mini-capitulation.
21 printed as market satisfaction. I noted it.
Chop and all, to the tick, we may not get there, so don't bust my chops. ;^>
Sure, I'll bite.
I follow a chain of MA's in varying time-frames with numbers manipulated to coincide with daily numbers. The equivalent of a 3 day typical MA, in my 20 chart, assumed by the equivalent of the 1 day MA. I noticed it first in a series longs to retest. MA crossovers, &ct., but the way I have my charts you can see if prices are rejecting by not hitting the .25%'s. in consolidating periods. And if they do, I stay the position until lower MA's ride above the 55 for a spell. Then the mini-capitulation.
21 printed as market satisfaction. I noted it.
Chop and all, to the tick, we may not get there, so don't bust my chops. ;^>
Originally posted by BruceM
we are watching...just busting on ya but if you want to give us a reason why you thought that would print then that would be helpfulOriginally posted by ramiegram
21 PRINT!
Watch
Click image for original size
thanks....we closed one tic off the midpoint.....neutral days..!
Emini Day Trading /
Daily Notes /
Forecast /
Economic Events /
Search /
Terms and Conditions /
Disclaimer /
Books /
Online Books /
Site Map /
Contact /
Privacy Policy /
Links /
About /
Day Trading Forum /
Investment Calculators /
Pivot Point Calculator /
Market Profile Generator /
Fibonacci Calculator /
Mailing List /
Advertise Here /
Articles /
Financial Terms /
Brokers /
Software /
Holidays /
Stock Split Calendar /
Mortgage Calculator /
Donate
Copyright © 2004-2023, MyPivots. All rights reserved.
Copyright © 2004-2023, MyPivots. All rights reserved.