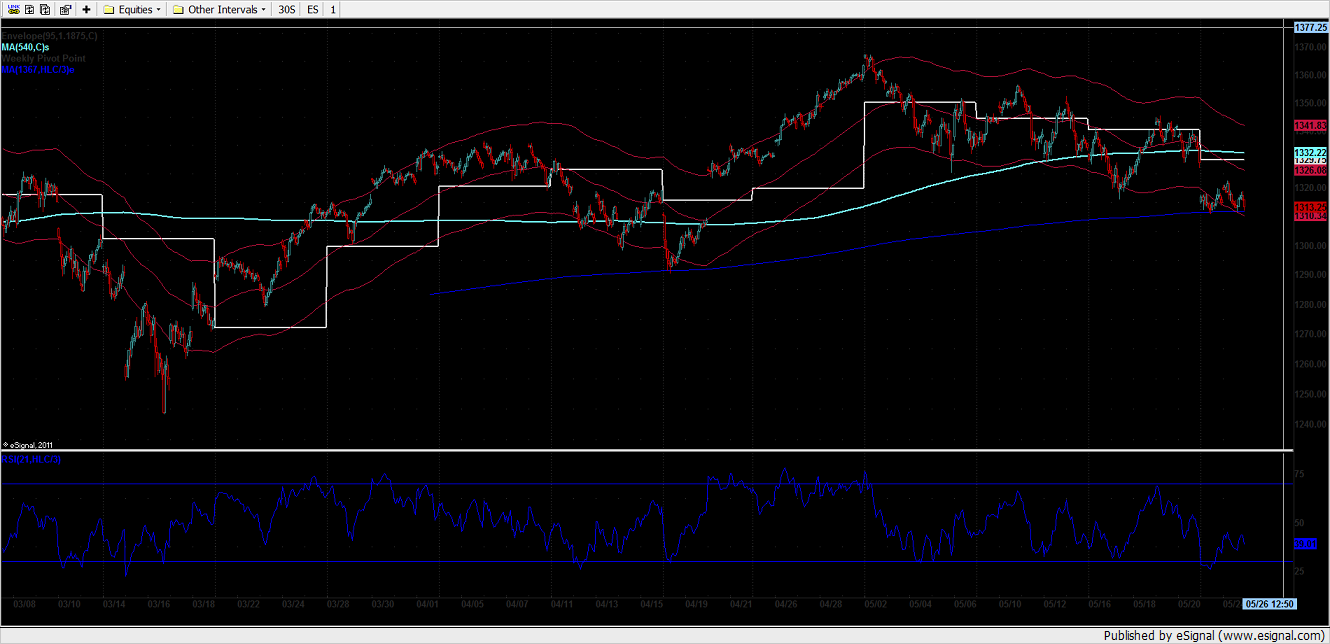
ES Outlook Chart
This chart's in essence a three-day swing chart but read intuitively can be used to forecast delivery-to-delivery with cues of directionality in the immediate forward contract.
The envelope is 7/7 (7 day high and 7 day low) scaled to 1.1875, which is read as: "the 180° projection of 1 full cycle of 4 complete cycles of 75%". The stairs are the three week pivot. The cyan MA is the 40 MA daily. And the blue MA is the rolling three week pivot.
Action in the upper 25% above the 7 day mean, long; at the mean, neutral; and below, unless otherwise noted, positioning long. I'll get to that in a minute. Action above the envelope long without fail is a minor intraday correction, most always lasting from EOD (end of day to 10:30 AM the next day. The opposite for short. Rarely will smart money initiate these corrections, but they'll finish them. These are the swings most are reluctant to hold over night, having been burned on retracements one or twice (once or twice) when they wake up.
Please honor what the rolling three week rolling pivot indicates. Quants hit or miss these numbers on purpose. Stops to buy the selloff are placed a healthy distance from them. If hit, it'll bounce. If prices are attracted, there's pressure if not full rotation.
How I arrive at the numbers scaled:
Divide a daily MA by 6.75 for the trading day for a 60 minute. Multiply that number by 2 for a 30, by 3 for a 20 and divide it by 4 for a 240.
At 22, the RSI is a 13 day MA scaled by the extreme lowest 1/8th percentile.
With a keen eye and patience there's a trade a day and two weekly swings out of this chart. Learn to read vacuum trades with this chart, and find the 50.
Not for some. It'll make and save you money.
Click image for original size
Correction: That should have read "multiply the daily ma by 6.75".
Emini Day Trading /
Daily Notes /
Forecast /
Economic Events /
Search /
Terms and Conditions /
Disclaimer /
Books /
Online Books /
Site Map /
Contact /
Privacy Policy /
Links /
About /
Day Trading Forum /
Investment Calculators /
Pivot Point Calculator /
Market Profile Generator /
Fibonacci Calculator /
Mailing List /
Advertise Here /
Articles /
Financial Terms /
Brokers /
Software /
Holidays /
Stock Split Calendar /
Mortgage Calculator /
Donate
Copyright © 2004-2023, MyPivots. All rights reserved.
Copyright © 2004-2023, MyPivots. All rights reserved.