ES Day Trading 5-25-2011
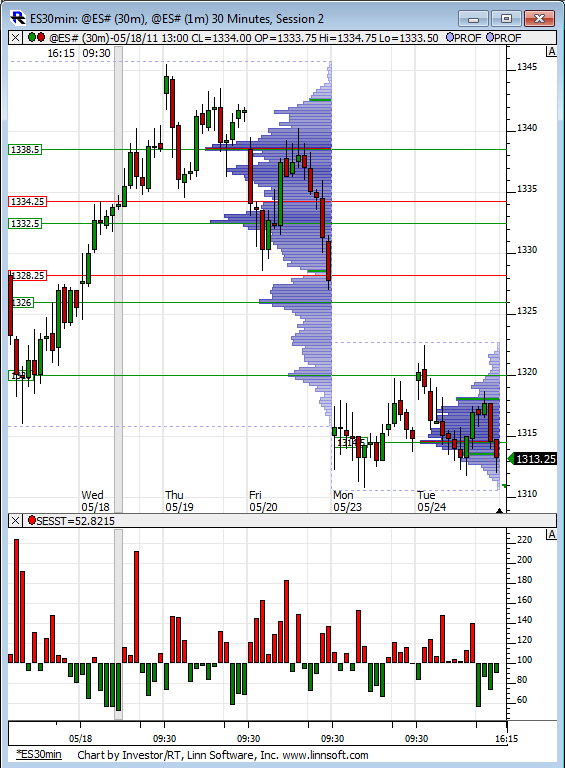
Two vprofiles on this chart. Last weeks and the developing one for this week. Tight range so far this week and the bell curve shaped profile signaling a fight between bulls and bears. Interesting to note VPOC is below last weeks range.
Click image for original size
abandoning short idea righ now...too close to reports and no room...
open outside of range and rejected back quick so far...waiting for 10 am
open outside of range and rejected back quick so far...waiting for 10 am
too bad report so close
hi koolblue, what was the logic behind this short? thanks
Originally posted by koolblue
short from 13.50
i would not worry too much abt the 10am report...it is second tier data at best...
Originally posted by Lisa P
too bad report so close
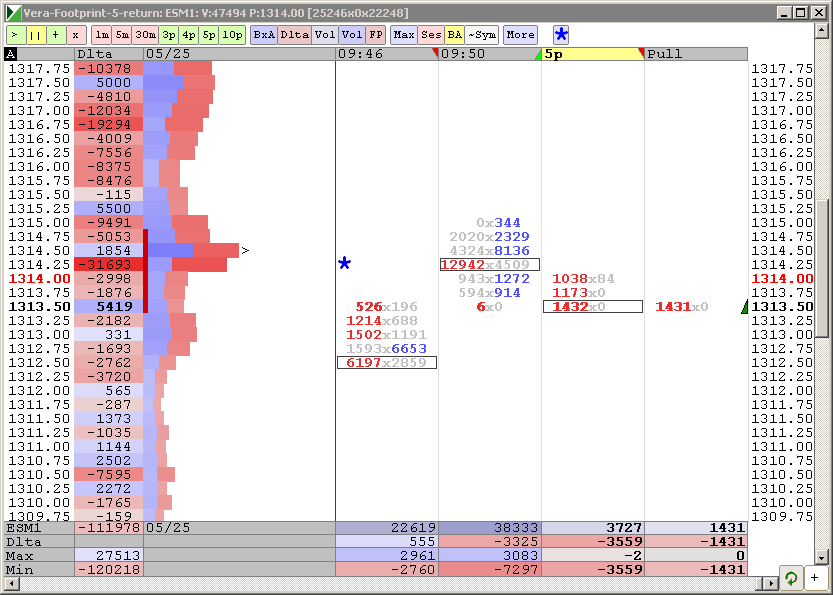
my plan is to hope for a spike higher up into 17.50 or higher and look for sells....peak volume from YD day session is 1315, secondary peak volume is up near 17.75...so target would be back down to 1315 off any higher sells...
we'll see
we'll see
Originally posted by NickP
hi koolblue, what was the logic behind this short? thanks
Originally posted by koolblue
short from 13.50
Click image for original size
thanks a lot !
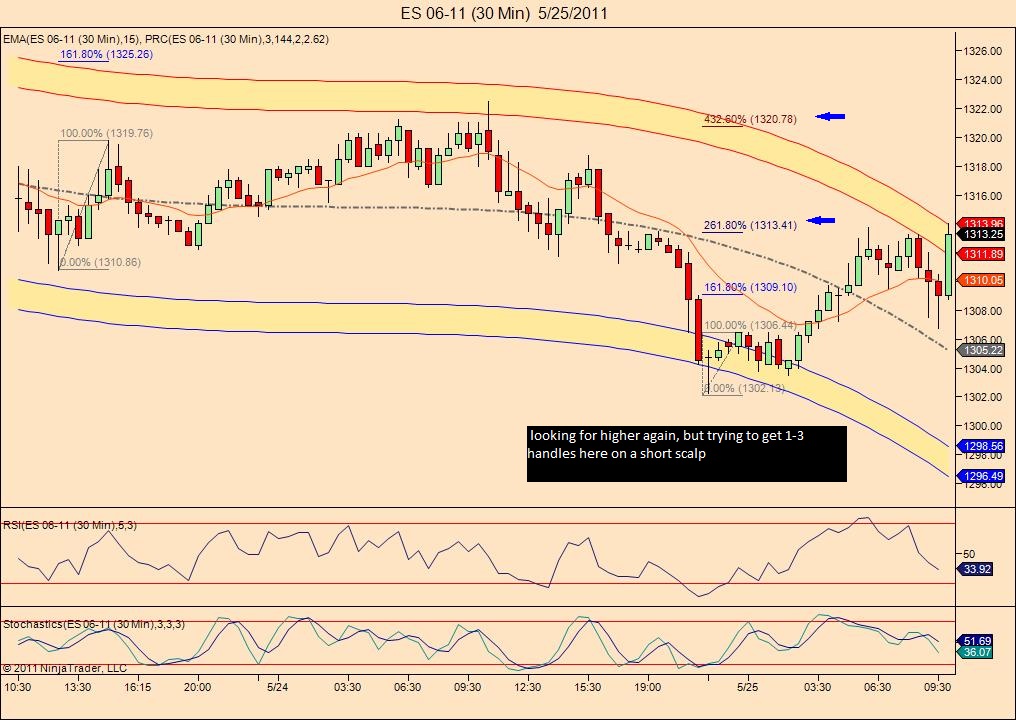
Hoping for a move to around 1310.50 but 1312.25 has to give way first...so far by only 2 ticks. Stop is at 1315.50
Covering here at 1311.00
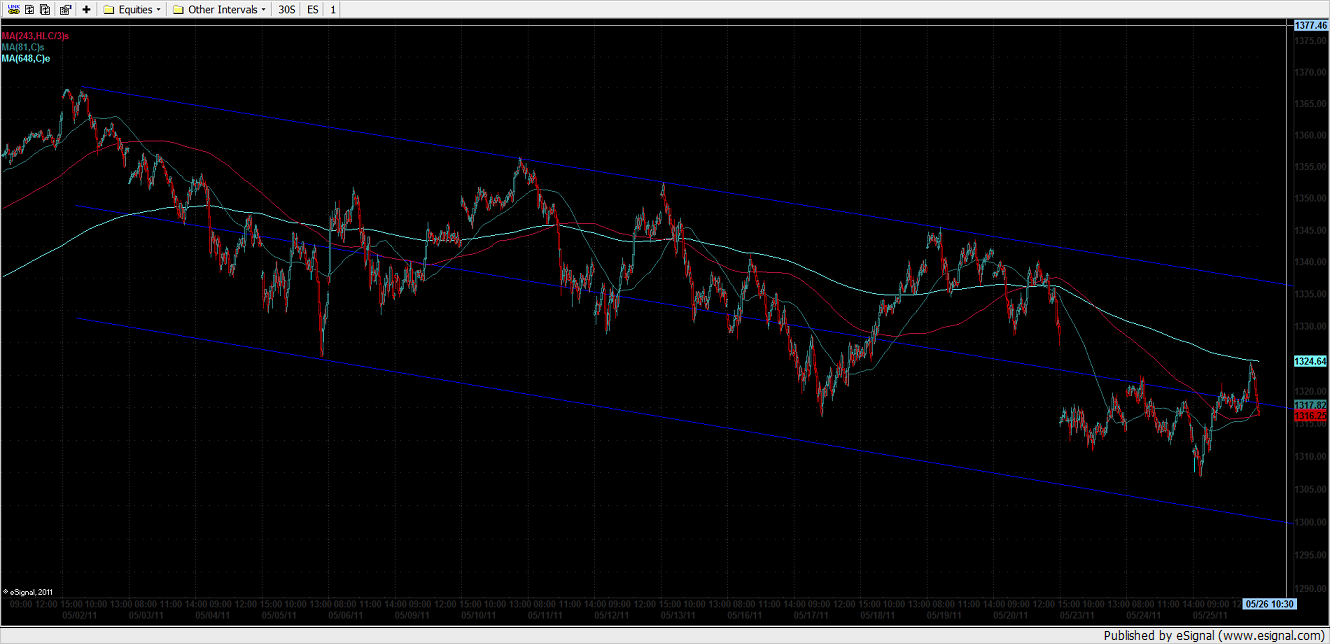
There's divergence in this market. This is a 5 min (daily numbers: 1 SMA, 3 typical SMA, & 8 EMA. The 8's leveling off and the 1 and 3 are trying to drive prices lower. Some heavy chop swings coming down the pike.
Chop I says. 12, 16, 21, 35, 43 I says.
Chop I says. 12, 16, 21, 35, 43 I says.
Click image for original size
Emini Day Trading /
Daily Notes /
Forecast /
Economic Events /
Search /
Terms and Conditions /
Disclaimer /
Books /
Online Books /
Site Map /
Contact /
Privacy Policy /
Links /
About /
Day Trading Forum /
Investment Calculators /
Pivot Point Calculator /
Market Profile Generator /
Fibonacci Calculator /
Mailing List /
Advertise Here /
Articles /
Financial Terms /
Brokers /
Software /
Holidays /
Stock Split Calendar /
Mortgage Calculator /
Donate
Copyright © 2004-2023, MyPivots. All rights reserved.
Copyright © 2004-2023, MyPivots. All rights reserved.