ES 6/30/11
Straight up usually stays that way until it doesn't if you think about it.
Maybe some surprising numbers you haven't thought about.
From the April high to the June low the fib levels are;
1280-23.6%
1297-38.2%
1310.50-50%
1324.25-62%
For June range the levels are;
1273.50
1286.50
1297
1307.75
respectively.
I'm currently using two different extensions(when in doubt)and the one previously mentioned has 1309 as the 161.8% level.
Alternatively,the other has 1305, 1310.50, and 1319.50 as the 123,138,and 161% levels.
Personally, I take the 50% levels as the strongest tell. Strength above,and weakness below. Note the levels that match up with others and they too are given a little more weight(ie;1297).
End of quarter really is only displayed in relative performance to peer funds and what looks best in required publishings to investors. I don't know if this lift is corrective or impulsive(5th wave). It doesn't really matter to me,yet.
I will point out it negated a head and shoulders down pattern and took out 6 previous highs on it's way up.
Trade em how you like as that's what it's all about.
flat now ..here is what the bell curve would look like now at these highs...I don't draw them in but shwoing it for any one who reads this and has interest....
will try one more time on sells if we break those highs...that would be low voluem
will try one more time on sells if we break those highs...that would be low voluem
Click image for original size
sold the plus 8 as planned
For those that pay attention to these sorts of things 1315, is a Gann square of 9 number....one below is 1297 and one above is 1333...
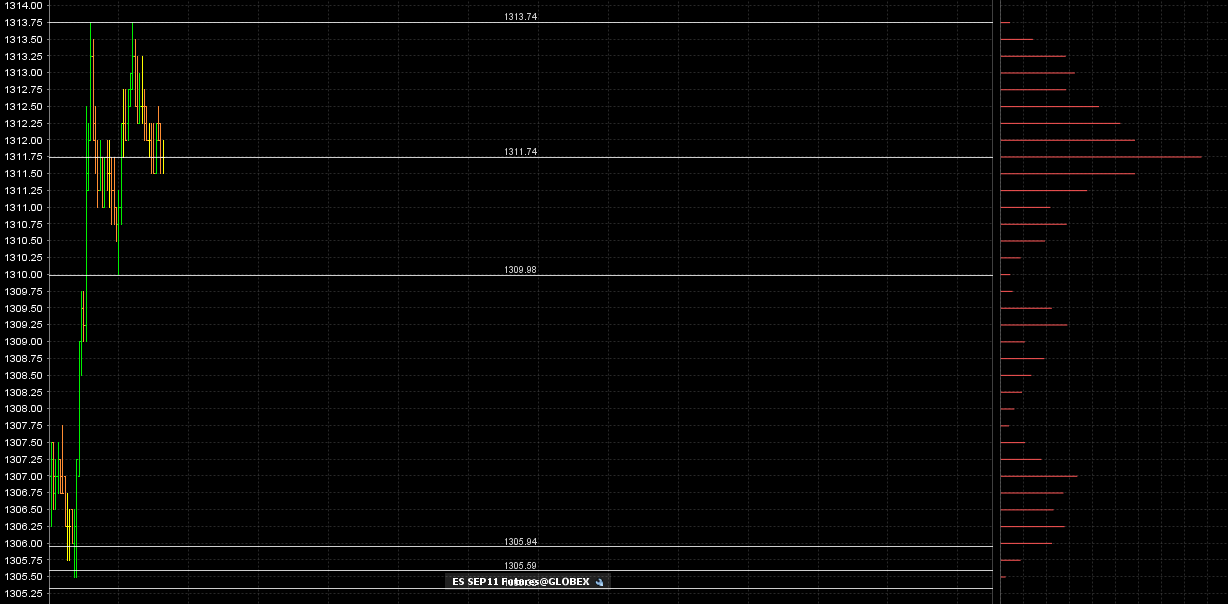
Piercing the daily 50 sma,around 1309 area
took all off but two at 11.75 print...that is the center of the distribution...and a possible buy point for those who like buying into volume..
Daily has three gaps from mid 1270 area. Maybe not important today?
Stocks, if you watch em, are relatively weak as most leaders are below previous highs here, and most significantly lower(ie:AAPL below 338 S/R level). AMZN almost touched previous highs yesterday, but not quite{if memory serves). Banks the tool for the hand and have been in a vacuum with a small lift here. Would think end of day might be important, maybe not.
Current focus on 1310.50 S/R and those extension levels.
Nice mention of Gann level. Thanks!
David
Forgive me for asking, I'm still learning to grasp many topics here...
What is you sma caluclated on. opening prices, daily highs, 50% of daily spread (o/n, rth?)? I just re read the sma definition and it states it could be based on different instances.
I'm not attempting to question your process, would just like a better understand of it. thanks
With this all said, the info that everyone in this thread throws out from time to time is REALLY starting to blow my mind! (meant to be funny here!
)
Originally posted by DavidS
Piercing the daily 50 sma,around 1309 area
got stopped on runners and resold hour high run...much , much smaller now....we are outside the 90 minute window ! market is still strong,,,gotta be careful now..
It's an indicator on my chart. I don't calculate anything. Off the top of my head I can't explain the difference between SMA and EMA to you. The Daily 50 ema is currently about 1297 though. Apologies for the lack of charts but have been having chart issues since before my vacation and trying to do less with em and keep it simple unti I'm satisfied they won't crash. Especially intraday.
fair enough, thanks for your honesty. I use to calculate my own pivots, but now I let the computer generate it because it always coincided with the daily pivots listed in the daily notes on this fourm.
A bit of caution though... My generated pivots have been different than the pivots listed in daily notes for the last few days. As of now I don't understand how that can be?
I haven't had time to figure it out yet. I only bring it up, because I get too reliant on the generated stuff. We got to keep on our toes, per say if you know what I mean.
Anywho, just throwing it out there. Thanks for your reply as well as all your post this morning.
Originally posted by DavidS
It's an indicator on my chart. I don't calculate anything. Off the top of my head I can't explain the difference between SMA and EMA to you. The Daily 50 ema is currently about 1297 though. Apologies for the lack of charts but have been having chart issues since before my vacation and trying to do less with em and keep it simple unti I'm satisfied they won't crash. Especially intraday.
Bruce - continued success and a happy Holiday weekend to you and the family. Many of us appreciate the sharing. Thanks.
Emini Day Trading /
Daily Notes /
Forecast /
Economic Events /
Search /
Terms and Conditions /
Disclaimer /
Books /
Online Books /
Site Map /
Contact /
Privacy Policy /
Links /
About /
Day Trading Forum /
Investment Calculators /
Pivot Point Calculator /
Market Profile Generator /
Fibonacci Calculator /
Mailing List /
Advertise Here /
Articles /
Financial Terms /
Brokers /
Software /
Holidays /
Stock Split Calendar /
Mortgage Calculator /
Donate
Copyright © 2004-2023, MyPivots. All rights reserved.
Copyright © 2004-2023, MyPivots. All rights reserved.