ES 6/30/11
Straight up usually stays that way until it doesn't if you think about it.
Maybe some surprising numbers you haven't thought about.
From the April high to the June low the fib levels are;
1280-23.6%
1297-38.2%
1310.50-50%
1324.25-62%
For June range the levels are;
1273.50
1286.50
1297
1307.75
respectively.
I'm currently using two different extensions(when in doubt)and the one previously mentioned has 1309 as the 161.8% level.
Alternatively,the other has 1305, 1310.50, and 1319.50 as the 123,138,and 161% levels.
Personally, I take the 50% levels as the strongest tell. Strength above,and weakness below. Note the levels that match up with others and they too are given a little more weight(ie;1297).
End of quarter really is only displayed in relative performance to peer funds and what looks best in required publishings to investors. I don't know if this lift is corrective or impulsive(5th wave). It doesn't really matter to me,yet.
I will point out it negated a head and shoulders down pattern and took out 6 previous highs on it's way up.
Trade em how you like as that's what it's all about.
covering all three at the 13.75...chart will follow...trying to hold other 3 ....still expecting the high to low day but lots of work to do....trade back to 15.75 will stop out runners...11.75 is next target
need this to stay inside inside hour range...would be even better if that 13.75 can hold back the rally here
DOUBLE Freakin trips on the 5! I never like thursdays....
If you look at your 30 minute bars today u can see why I was adding to my short trades ( add ons not posted). We had all those 30 minute bars with no retest of a previous 30 minute bars low.....so I was shorting into that as volume was dismal anticipating the test down...
Two of you have mentioned that my posting of my realtime trades has been a distraction to your own trading. I agree with that and respect that so from here on I will try to keep it to charts, visuals and concepts. Sometimes I was just trying to give an idea of what it was like to actually trade with the concepts.
Things like this would be better : " we have a ledge at 1312.50 and one up at 15.50" this is true right now and because of that I am trying to take something off just below that ledge...a revised target above the original 1311.75 ...
Bruce, personally i don't think your realtime trading posts are a distraction at all. If somebody is distracted by them then he/she should not be reading posts from a thread at all.
A lot of people here highlight levels they are looking to trade from and then give updates on how those trades are going or if they added or were stopped etc. I strongly encourage you to continue the type of posting you have had till today since it is very instructive, at least to me, since i trade on a very differnt basis but would like to continue learning from your style.
Whatever you decide from now on, thanks for your continued effort in making this site an invaluable one for traders.
I second what Nick just said Bruce,and i would underscore one thing you mentioned: "what it is to actually trade with the concepts".
You rarely get that anywhere, let alone for free...so why would somebody call it a distraction? i am sorry but i completely disagree with those who voiced their concern about your posting
keep it coming as it has been, it is simply awesome.
You rarely get that anywhere, let alone for free...so why would somebody call it a distraction? i am sorry but i completely disagree with those who voiced their concern about your posting
keep it coming as it has been, it is simply awesome.
Bruce I love the way you trade and post. Pls dont change a thing.
Thanks for the support..I appreciate it....I guess I may be a bit burned out myself and feeling guilty about sometimes posting trades which don't always have a great explanation attached to the posts.
I just sold the new high and here is why ...(next post ) .....they may waste me here
I just sold the new high and here is why ...(next post ) .....they may waste me here
if somebody has a doubt about your thought process, can always ask about it
again, i think your stuff comes through pretty clearly most times
again, i think your stuff comes through pretty clearly most times
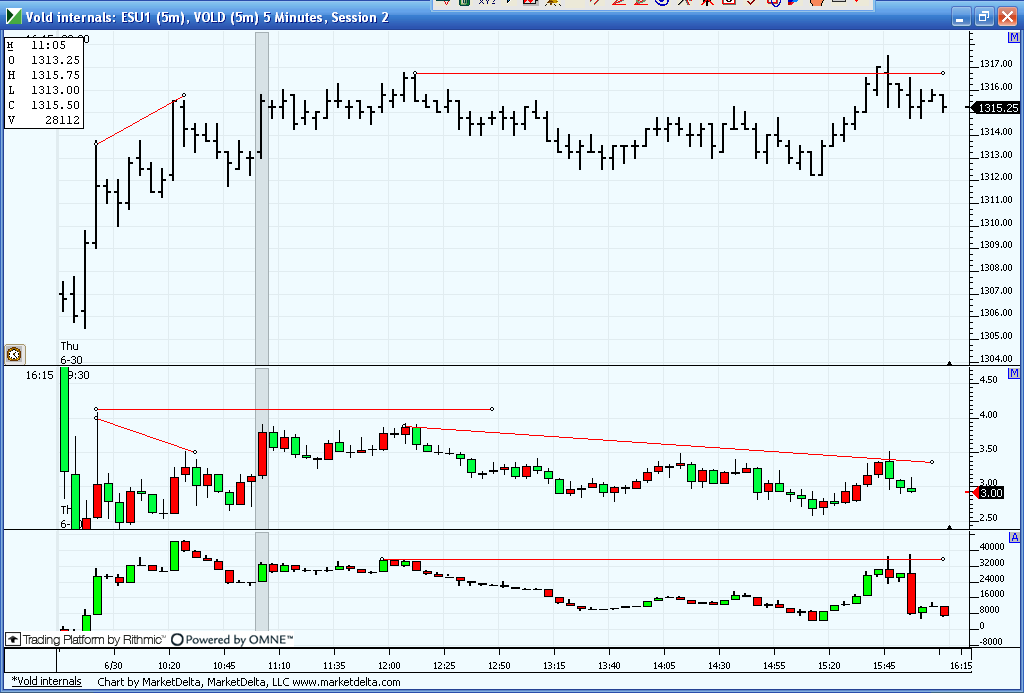
here is an experimental chart and a bit unfriendly to the eyes...It has ES up top, my version of the $vold in the middle and Cummulative delta in the bottom pane. With this version of Vold it gives bad information in the first 15 minutes...just too spikey...so it becomes more useful after 15 minutes but I only download it every 1/2 hour when I am at my other computer. In other words this hasn't made the cut yet as a new addition to the trading arsenal.
My intent is to qualify the divergences of CD and ES with the Vold. You can see the ES and CD made new highs but not the Vold at a bit after 10:20...in fact after where I had drawn the trendlines on VOLD was NEVER exceeded as price went higher...
look how CD busted it's swing highs when we made these new highs a few minutes ago but not the VOLD.
This will help to fiqure out when hidden divergences should be traded or faded....Not sure how many here follow this but my research shows much promise....now I need some new monitors to fit this stuff on my screen..
Don't let my crappy chart stop u from researching this on your own ..especially if u like CD ideas ..there are many little divergence where price and cd went higher but not the VOLD..often you will see swings taken out that don't get confirmed by the VOLD
Click image for original size
Bruce - continued success and a happy Holiday weekend to you and the family. Many of us appreciate the sharing. Thanks.
Emini Day Trading /
Daily Notes /
Forecast /
Economic Events /
Search /
Terms and Conditions /
Disclaimer /
Books /
Online Books /
Site Map /
Contact /
Privacy Policy /
Links /
About /
Day Trading Forum /
Investment Calculators /
Pivot Point Calculator /
Market Profile Generator /
Fibonacci Calculator /
Mailing List /
Advertise Here /
Articles /
Financial Terms /
Brokers /
Software /
Holidays /
Stock Split Calendar /
Mortgage Calculator /
Donate
Copyright © 2004-2023, MyPivots. All rights reserved.
Copyright © 2004-2023, MyPivots. All rights reserved.