ES 7-5-2011
Reference Numbers to start the week.
Weekly Close 1335.25 (4:15)
Weekly H/L 1336.5/1257 or 1336.5/1261.75 (RTH)
1339.00 Gap from 6-1
Single Prints 1330 and 1317.25
Currently the O/N MP Profile is showing a three TPO selling tail. Volume is above average so far so it should be interesting to see how RTH handles things.
Weekly Close 1335.25 (4:15)
Weekly H/L 1336.5/1257 or 1336.5/1261.75 (RTH)
1339.00 Gap from 6-1
Single Prints 1330 and 1317.25
Currently the O/N MP Profile is showing a three TPO selling tail. Volume is above average so far so it should be interesting to see how RTH handles things.
Bruce could you explain failure outside 60 min and does it also apply to 90 min
question for lorn or others who might use investor rt; what version of it do you use and what type of edition (standard or professional) ? thanks a lot
It basically just means that selling (in this example for today) doesn't increase as we break the 60 minute lows...so we mean revert...what made today so perfect is that the attempted breakdown came right into the low volume breakout points ( single prints)from fridays trade...
Quite often when the 60 minute fade doesn't workout you can try the same fade at the 90 minute highs or lows.....check out some charts u will see it.....Obviously when we trend these trades won't work that well and provide minimal opportunities for profits....everything in context....u know the drill..!! And thanks for asking the question
Quite often when the 60 minute fade doesn't workout you can try the same fade at the 90 minute highs or lows.....check out some charts u will see it.....Obviously when we trend these trades won't work that well and provide minimal opportunities for profits....everything in context....u know the drill..!! And thanks for asking the question
Originally posted by rburns
Bruce could you explain failure outside 60 min and does it also apply to 90 min
another thing...u saw the losing trade campaign on Friday...quite often when you see two or three sets of single prints that hold ( ones that don't fill on the same day)...then the market players quite often make a big effort to fill in the last ones created on the day...those like to get filled in the following day.....
just something to tuck away in your war chest !! Friday had two sets of singles...one filled in today..
just something to tuck away in your war chest !! Friday had two sets of singles...one filled in today..
I use the latest version which is 10.4.2 and its the professional MP edition.
Originally posted by NickP
question for lorn or others who might use investor rt; what version of it do you use and what type of edition (standard or professional) ? thanks a lot
...and btw I use IQfeed from DTN.iq for my data.
Originally posted by Lorn
I use the latest version which is 10.4.2 and its the professional MP edition.
Originally posted by NickP
question for lorn or others who might use investor rt; what version of it do you use and what type of edition (standard or professional) ? thanks a lot
bruce re: 60 minute breakouts. i did a bunch of research into that over the weekend and couldnt find anything consistent with any of my ideas to trade them. however, your comment about volume has caught my attention. you said that when volume increases (i.e. more selling when breaking new lows), it means it's more likely to be a true breakout. what do you define as increased volume? at what time after the initial breakout do you say ok...in this x minute period, volume has increased...and how much volume increase is considered a "vol increase" by your definitions?
good afternoon Lorn
can you put up a chart from last fri VOL where the VOL was big
can you put up a chart from last fri VOL where the VOL was big
Originally posted by Lorn
...and btw I use IQfeed from DTN.iq for my data.
Originally posted by Lorn
I use the latest version which is 10.4.2 and its the professional MP edition.
Originally posted by NickP
question for lorn or others who might use investor rt; what version of it do you use and what type of edition (standard or professional) ? thanks a lot
Bruce will give you his own answer but I thought I'd chime in for its an important subject you are talking about.
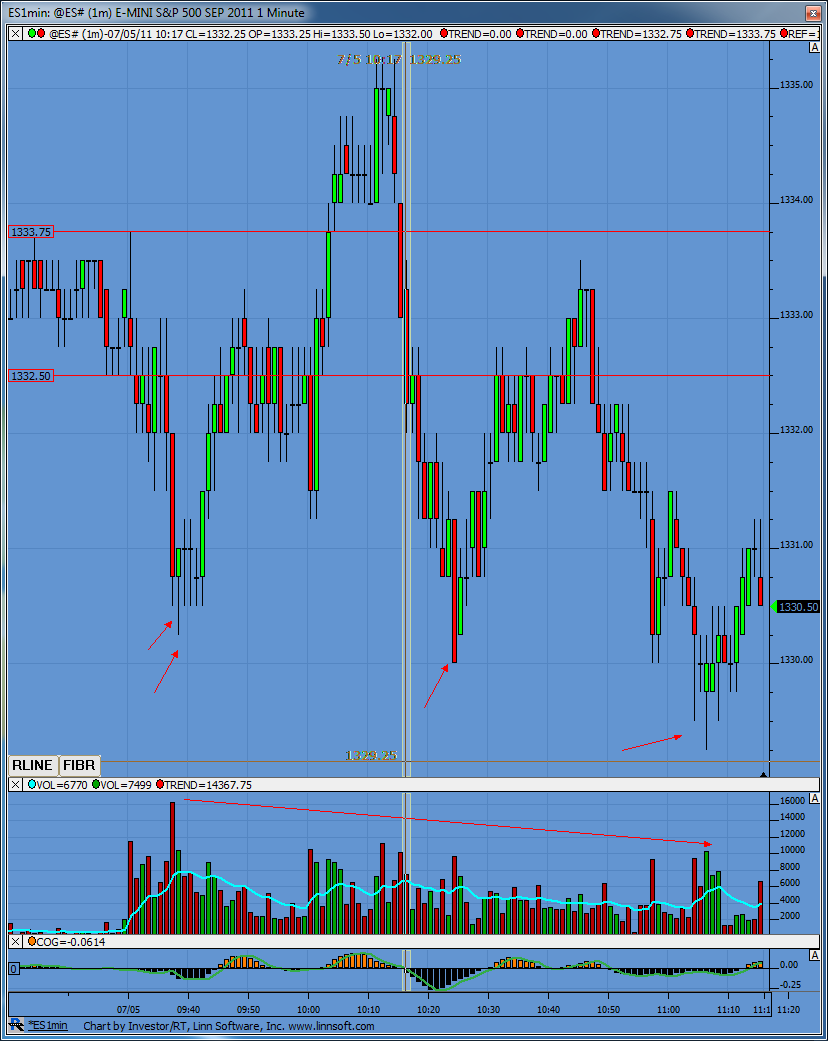
I watch 1-min volume spikes throughout the day to indicate to me when big money is entering/exiting. Take a look at this 1-min chart. I've marked some of the pivot lows with arrows. You can see the first two come in at 1330.25-1330.50. Look at the volume bars. The biggest spike came here and it was bigger then the opening volume so this gets marked for me as a volume reference going forward.
Now notice every other marked pivot low comes on a lower volume spike then the first one. In fact, the second biggest 1-min volume spike comes at the 1335.25 high (which I don't have marked but is time stamp 10:13).
So as prices tried to break 60-min lows you can see volume wasn't increasing in comparison to that early spike I'm now using as reference.
Another thing to watch is PA (price action) as 1-min volume spikes occur. Do the spikes occur near the highs/lows or do they come in the middle of the range and what does price do after the spike occurs, does it rise, does it fall, where does it close and do you see spikes happening in a trending fashion, for instance, if after that early 35.25 high was set and we saw additional big 1-min volume spikes happening as price traded back down towards the 60 min low it would be an early warning sign for me that there might be more gas to the downside because price keeps falling after spikes enter.
So my point really is we can't define a volume increase as x percent over some other time period, although that can be very useful and I do pay attention to that kind of statistic.
In the heat of the battle its context which is so important.
And remember, nothing works 100% of the time nor will our interpretations be 100% correct.
Think of it like playing golf. To be a better golfer two things happen, you learn to recover from poor shots and your poor shots get better...
Hope that all made sense.
Click image for original size
Originally posted by feng456
bruce re: 60 minute breakouts. i did a bunch of research into that over the weekend and couldnt find anything consistent with any of my ideas to trade them. however, your comment about volume has caught my attention. you said that when volume increases (i.e. more selling when breaking new lows), it means it's more likely to be a true breakout. what do you define as increased volume? at what time after the initial breakout do you say ok...in this x minute period, volume has increased...and how much volume increase is considered a "vol increase" by your definitions?
Are you wanting to see the volume laid out in profile style (volume per price) or standard volume per time period?
Originally posted by della
good afternoon Lorn
can you put up a chart from last fri VOL where the VOL was big
Feng, I did a thread on one minute volume spikes. I think Lorn covered all the key points though in his reply. I always look to see if we can get big $ticks on push outs of key ranges also to see if prolonged lower or higher readings prevail. Today we had higher lows in the $tick when we broke that hour low. That helps with the entry.
I began a research project about two months ago with the footprint charts that I look at after the market closes to help refine entries but so far that has been a worthless pursuit. I can't find an edge with that. As you know I add to trades so there is an element of "Gut feel" to some of this. My Market delta software has some cool volume with time functions that I have been messing with. To help show momentum or the lack of momentum.
For now I just take the trade as long as it is in proper context. I'm unafraid to add. Trust me when I tell you that I am working hard to remove the discretionary elements of my trading. Posting ideas to the forum helps me realize how hard it would be to "teach" certain elements of trading as I know it.
Many times you will not get that great mean reversion trade but often you will get the retest back to the 60 and 90 minute highs or lows after they break it out. I will add to trades expecting retest back. So often I am wrong on the first part of the campaign. hope that helps.
Emini Day Trading /
Daily Notes /
Forecast /
Economic Events /
Search /
Terms and Conditions /
Disclaimer /
Books /
Online Books /
Site Map /
Contact /
Privacy Policy /
Links /
About /
Day Trading Forum /
Investment Calculators /
Pivot Point Calculator /
Market Profile Generator /
Fibonacci Calculator /
Mailing List /
Advertise Here /
Articles /
Financial Terms /
Brokers /
Software /
Holidays /
Stock Split Calendar /
Mortgage Calculator /
Donate
Copyright © 2004-2023, MyPivots. All rights reserved.
Copyright © 2004-2023, MyPivots. All rights reserved.