ES Big Pic View for Friday
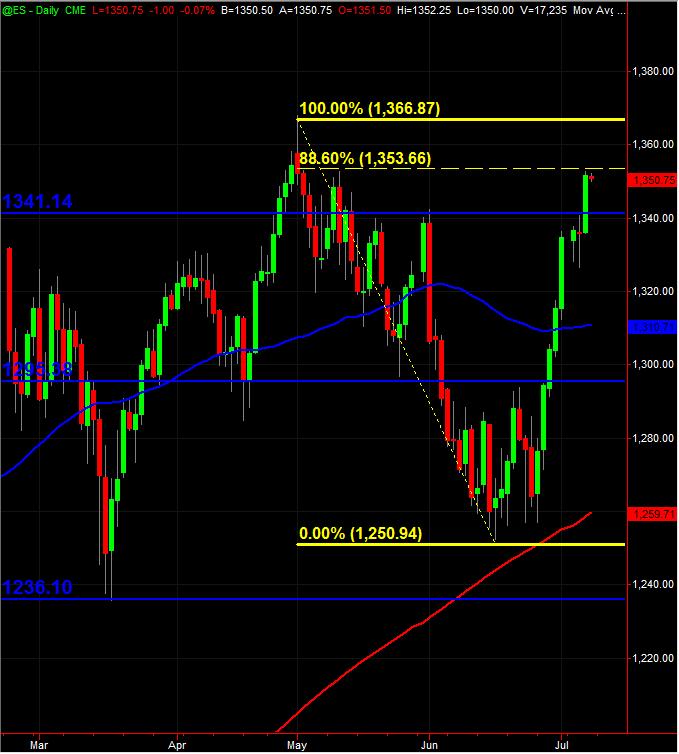
Here's my Daily ES continuous contract chart (All Trading Hours) with the Fib Retracement of 88.6 using TS. Jim Kane probably has this in his forum ... but thought I'd post it here. Maybe Jimbo, you could add to this and describe how valid or not it may be along with other factors that should be considered.
For anyone else, this is a topic to post YOUR BIG PIC view of the ES.
Obviously the (un)employment report can always create funky chaos. This ain't intended to be the ES intraday trading thread, but rather something we can all dog pile in on with each of our different big pic postings of charts to potentially incorporate into Friday's trading session.
MM
For anyone else, this is a topic to post YOUR BIG PIC view of the ES.
Click image for original size
Obviously the (un)employment report can always create funky chaos. This ain't intended to be the ES intraday trading thread, but rather something we can all dog pile in on with each of our different big pic postings of charts to potentially incorporate into Friday's trading session.
MM
NQ has not even generated a 30min close below 50% (24hr) of the week which is 2386.63
ES 50% of the globex week is 1340.50
potential for some sort of intraday rebound is real, but sometimes, price has to probe lower, retest/undercut lows during RTH to make sure the bear boat is loaded before the trap snaps and price moves higher causing newly positioned bears to sweat and then buy... it can happen.
big money that couldn't get positioned in the upper 40's and low 50's can bring more money to the table than you or I have... they can push price up, forcing covering, unlocking volume so they can position themselves short at much better prices than just selling here in the low 30's.
it can happen.
Didn't see it mentioned but 1332 is the master KEY level whatever your hopes and dreams are.
Sharp correction no doubt. Can double down just as quick.
1315 the 38% retrace and 1305 the 50% for the entire move from 1252.
Would require loss of 1332 and 1326.50 100% of last wave up.
1340 R as noted by Paul.
Sharp correction no doubt. Can double down just as quick.
1315 the 38% retrace and 1305 the 50% for the entire move from 1252.
Would require loss of 1332 and 1326.50 100% of last wave up.
1340 R as noted by Paul.
Sorry, meant from 1257 fib for levels
Emini Day Trading /
Daily Notes /
Forecast /
Economic Events /
Search /
Terms and Conditions /
Disclaimer /
Books /
Online Books /
Site Map /
Contact /
Privacy Policy /
Links /
About /
Day Trading Forum /
Investment Calculators /
Pivot Point Calculator /
Market Profile Generator /
Fibonacci Calculator /
Mailing List /
Advertise Here /
Articles /
Financial Terms /
Brokers /
Software /
Holidays /
Stock Split Calendar /
Mortgage Calculator /
Donate
Copyright © 2004-2023, MyPivots. All rights reserved.
Copyright © 2004-2023, MyPivots. All rights reserved.