ES 7-13-11
Void below. Island reversal, Daily chart gaps. Looks good. Maybe too good.
Diagonals create their own support if you think about it. That's why I'm thinking it about the only possibilty left for higher.
Projecting from 1295.25 low gives a minimum 5th wave of about 1380.
I know, doesn't seem likely.
Also, diagonals are made of 3 wave moves.
Free your mind?
1325 and 1332 above.
1320 and 1317.25 below.
Out @1321.00
thanks
the 8.30 et long was the one i saw and it looks like it could have worked for a few points before getting stopped on the next bar (looking at 1pt stops below/above previous low/high for simplicity)
there could have been a long at 10.30, a short at 11.30 (all eastern) if taken at the open of the bar and another long at 3pm that would have gone bust according to what i saw....i have been wrong before lol !
how do you deal with situation where you have a potential long that gets busted right on the fourth bar and at the same time a short is potentially developing ? (the 10.30 and 11.30 are examples of this)
do you have any other filtering you use ? thanks for your help !
1321 hit,complete reversal up possible,under is 1320, under it,more weakness and 1318-1317.25 area
power on/off here(thundestorms)
maybe later?
power on/off here(thundestorms)
maybe later?
Originally posted by NickP
thanks
the 8.30 et long was the one i saw and it looks like it could have worked for a few points before getting stopped on the next bar (looking at 1pt stops below/above previous low/high for simplicity)
there could have been a long at 10.30, a short at 11.30 (all eastern) if taken at the open of the bar and another long at 3pm that would have gone bust according to what i saw....i have been wrong before lol !
how do you deal with situation where you have a potential long that gets busted right on the fourth bar and at the same time a short is potentially developing ? (the 10.30 and 11.30 are examples of this)
do you have any other filtering you use ? thanks for your help !
1) I only trade RTH, just better for me.
2) I look for a swing hi or low, new hi or low, continuation, then entry within 1 point of the "wrong" end of the candle. using 30 minute TF. So I watch for 3 bars and enter on the 4th if there.
3) Today's long at 9:30 did not have 5 points in it IMO, due to yesterday's high and it was too risky for my stop after that "news" candle. So I passed.
Hope this helps, I am looking for good trades only and may get 3-5 trades per week on this setup with 60%+ and 2.00 expectancy. I need simple, some setups here work great but give me a brain ache-LOL
thanks for the reply
btw, all the entries i mentioned were based on yesterday, not today
btw, all the entries i mentioned were based on yesterday, not today
Originally posted by Big Mike
Originally posted by NickP
thanks
the 8.30 et long was the one i saw and it looks like it could have worked for a few points before getting stopped on the next bar (looking at 1pt stops below/above previous low/high for simplicity)
there could have been a long at 10.30, a short at 11.30 (all eastern) if taken at the open of the bar and another long at 3pm that would have gone bust according to what i saw....i have been wrong before lol !
how do you deal with situation where you have a potential long that gets busted right on the fourth bar and at the same time a short is potentially developing ? (the 10.30 and 11.30 are examples of this)
do you have any other filtering you use ? thanks for your help !
1) I only trade RTH, just better for me.
2) I look for a swing hi or low, new hi or low, continuation, then entry within 1 point of the "wrong" end of the candle. using 30 minute TF. So I watch for 3 bars and enter on the 4th if there.
3) Today's long at 9:30 did not have 5 points in it IMO, due to yesterday's high and it was too risky for my stop after that "news" candle. So I passed.
Hope this helps, I am looking for good trades only and may get 3-5 trades per week on this setup with 60%+ and 2.00 expectancy. I need simple, some setups here work great but give me a brain ache-LOL
Nick,
"there could have been a long at 10.30, a short at 11.30 (all eastern) if taken at the open of the bar and another long at 3pm that would have gone bust according to what i saw....i have been wrong before lol !"
The 10:30 is too early for me, since I start in RTH. I have something else I do around the open.
Looking at yesterday's chart (my partner the mast note taker is out this afternoon) I see only the one breakeven. Long at 1216.75 in the noon ET candle. 2.25 green, then stopped out breakeven. Was looking to break the afternnon swing high from Monday. No soup for me!
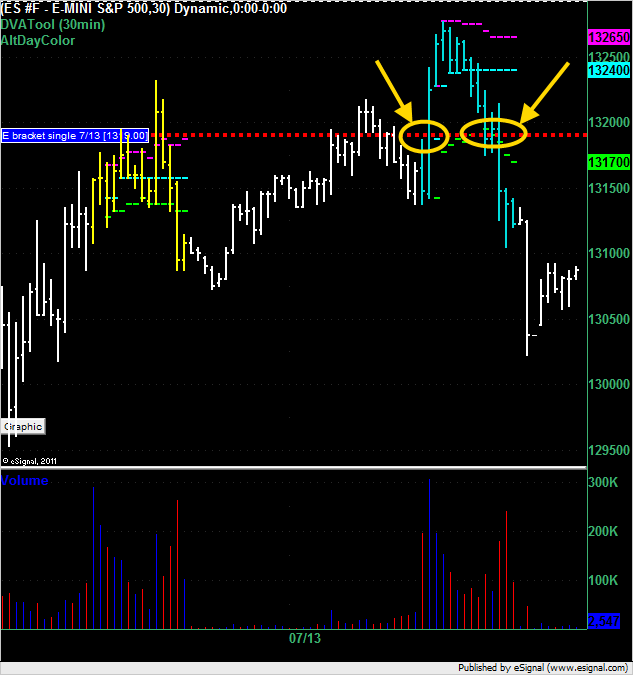
The E bracket created a single print at 1319 during the morning's section (first circle). According to Market Profile theory this becomes a support area because the market was moving up. The theory states that you would target profits or enter a counter directional trade when the market returns there.
Had you entered a long at that price you would have suffered up a 1.5 point draw down over the next 3 brackets (second circle). The market moved up to 1321.50 for a best run up of 2.5 points. Ultimately you would have lost money on that trade if you were targeting 2.5 or more points (unlikely that you would have been filled at 2.5) and had a stop greater than 1.5 points. i.e. I can't say if you would would have profited, broken even or lost on that trade, it would have depended on your money management / stop loss / profit target strategy.
PS On days where there was a single print in action I'm going to try and give a summary at the end of the day like this when I have time.
Had you entered a long at that price you would have suffered up a 1.5 point draw down over the next 3 brackets (second circle). The market moved up to 1321.50 for a best run up of 2.5 points. Ultimately you would have lost money on that trade if you were targeting 2.5 or more points (unlikely that you would have been filled at 2.5) and had a stop greater than 1.5 points. i.e. I can't say if you would would have profited, broken even or lost on that trade, it would have depended on your money management / stop loss / profit target strategy.
Click image for original size
PS On days where there was a single print in action I'm going to try and give a summary at the end of the day like this when I have time.
Great info DT. One question, is that a typo on the "E" candle? I can't see how 9:00 CT is "E"?
Originally posted by Big Mike
Great info DT. One question, is that a typo on the "E" candle? I can't see how 9:00 CT is "E"?
Traditionally the D candle starts at 8:30CT and the E at 9:00CT. If you look at the Market Profile Calculator you'll see that it defaults to D as the first bracket.
Originally posted by day trading
Originally posted by Big Mike
Great info DT. One question, is that a typo on the "E" candle? I can't see how 9:00 CT is "E"?
Traditionally the D candle starts at 8:30CT and the E at 9:00CT. If you look at the Market Profile Calculator you'll see that it defaults to D as the first bracket.
More great info! Thanks DT.
Emini Day Trading /
Daily Notes /
Forecast /
Economic Events /
Search /
Terms and Conditions /
Disclaimer /
Books /
Online Books /
Site Map /
Contact /
Privacy Policy /
Links /
About /
Day Trading Forum /
Investment Calculators /
Pivot Point Calculator /
Market Profile Generator /
Fibonacci Calculator /
Mailing List /
Advertise Here /
Articles /
Financial Terms /
Brokers /
Software /
Holidays /
Stock Split Calendar /
Mortgage Calculator /
Donate
Copyright © 2004-2023, MyPivots. All rights reserved.
Copyright © 2004-2023, MyPivots. All rights reserved.