ES Thur 7-21-11
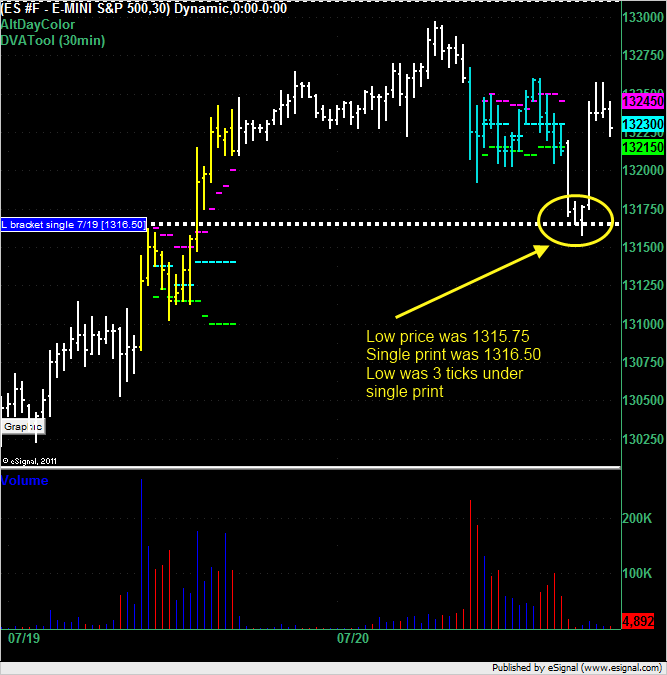
L bracket single print at 1316.50 from Tuesday's session formed the support price for early overnight action for Thursday's trading session. Low price dropped down to 1315.75 and single print was 1316.50. Draw down was 3 ticks and max run-up was 1325.75 (9.25 points from single print) so far.
(No I did not trade this. Yes this is after the fact. As I stated a few days ago I'm going to try and point out winning and failing single print trades. Although this is a great example of a winning one there are losing ones as well. I'll try and point them all out. Let me know if I miss any - both winning and losing.)
Click image for original size
(No I did not trade this. Yes this is after the fact. As I stated a few days ago I'm going to try and point out winning and failing single print trades. Although this is a great example of a winning one there are losing ones as well. I'll try and point them all out. Let me know if I miss any - both winning and losing.)
WTF was that?
Spike up?
cnbc carried a piece that supposedly NYTimes had on site that deal on debt had been reached
but just now,12:49pm, now cnbc carrying item that NYT is wrong, WHite house says No Deal
cnbc carried a piece that supposedly NYTimes had on site that deal on debt had been reached
but just now,12:49pm, now cnbc carrying item that NYT is wrong, WHite house says No Deal
NYT reported deal with congress. White house says report is false, no deal yet
at least we know now where the sellers are...lol
DT, in your chart .. Nison would call that a spring .. price target to upside would be the most recent high ..
good stuff Thanks
good stuff Thanks
I like to watch hour candles.
In AH I believe the candles can qualify a top here. I have no requirement that the daily gap closes(otherwise we'd be at
the 1150 area).
1350 is a target, they're not worth losing money over and can catch up with a run. Can still go there but this is contrarian trading.
It could spike to it and reverse before one can trade it.
Diagonal vs. H&S??
It can do it all really.
Summary of market profile single prints from today.
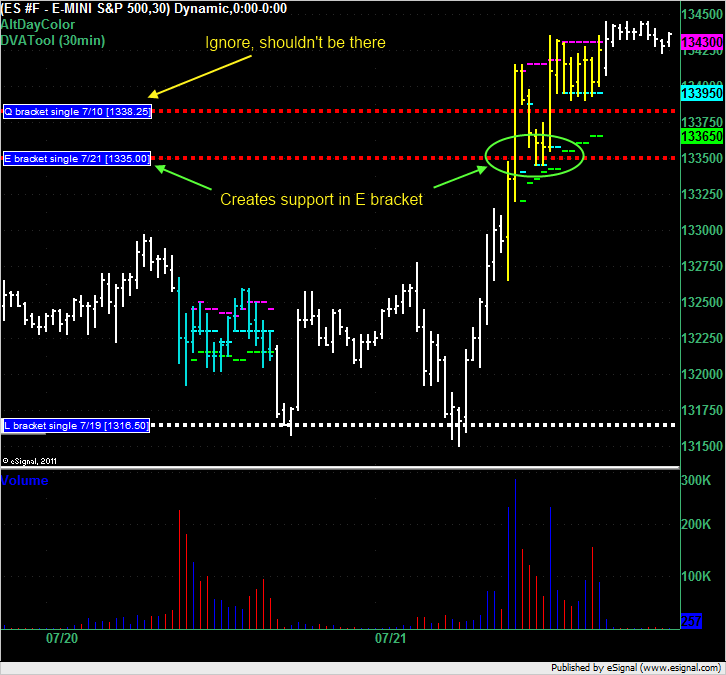
On the chart, the first item to note is that a single print was created at 1335.00 in the E bracket. This provided a long with a draw down of 2 ticks to the next low of 1334.50 and a max run up subsequent high of 1343.50 (max run up 8.5 points). Now don't go getting all giddy thinking that you've just stumbled onto the holy grail because the last few signals have worked so well because these signals can fail as well. Note that the single print only formed when the F bracket closed.
The next item on the chart looks like a bug in the DVATool software that I'm going to have to look into fixing. It's the Q bracket single print that was created on 7/10/11. If you go back to that day and look at the chart you'll see that the single print was created as a support level in a rising market and the follow day the market opened below this price so that single print should have been removed. i.e. that price should be ignored.
Click image for original size
Originally posted by redsixspeed
DT, in your chart .. Nison would call that a spring .. price target to upside would be the most recent high ..
good stuff Thanks
Can you elaborate on what a spring is? I'm not sure if I could technically identify one again...
Originally posted by day trading
Originally posted by redsixspeed
DT, in your chart .. Nison would call that a spring .. price target to upside would be the most recent high ..
good stuff Thanks
Can you elaborate on what a spring is? I'm not sure if I could technically identify one again...
======================================================================
Identify a support ... market moves below several ticks ... then back above ... volume is my confirmation ... market should not break back below the area where it moved below the support ... thats what happened with your single prints ... the target is the most recent high ..
If the market breaks below the spring (the area it moved below the support) the trader has to make a decision ... There is another type of spring I posted in topic candle pattern
as far as you may not be able to identify one again .. I think your pulling my leg ...
Thanks redsixspeed - appreciate the elaboration!
Emini Day Trading /
Daily Notes /
Forecast /
Economic Events /
Search /
Terms and Conditions /
Disclaimer /
Books /
Online Books /
Site Map /
Contact /
Privacy Policy /
Links /
About /
Day Trading Forum /
Investment Calculators /
Pivot Point Calculator /
Market Profile Generator /
Fibonacci Calculator /
Mailing List /
Advertise Here /
Articles /
Financial Terms /
Brokers /
Software /
Holidays /
Stock Split Calendar /
Mortgage Calculator /
Donate
Copyright © 2004-2023, MyPivots. All rights reserved.
Copyright © 2004-2023, MyPivots. All rights reserved.