ES Trading for Mon 7-25-11
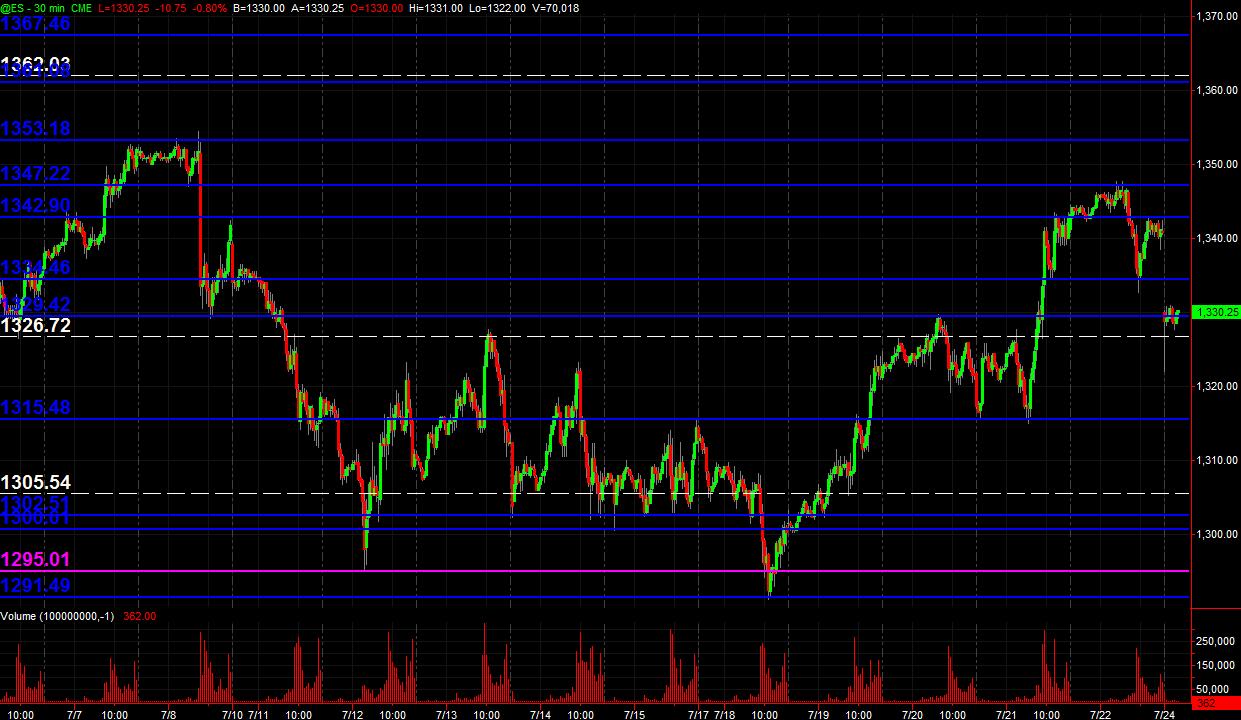
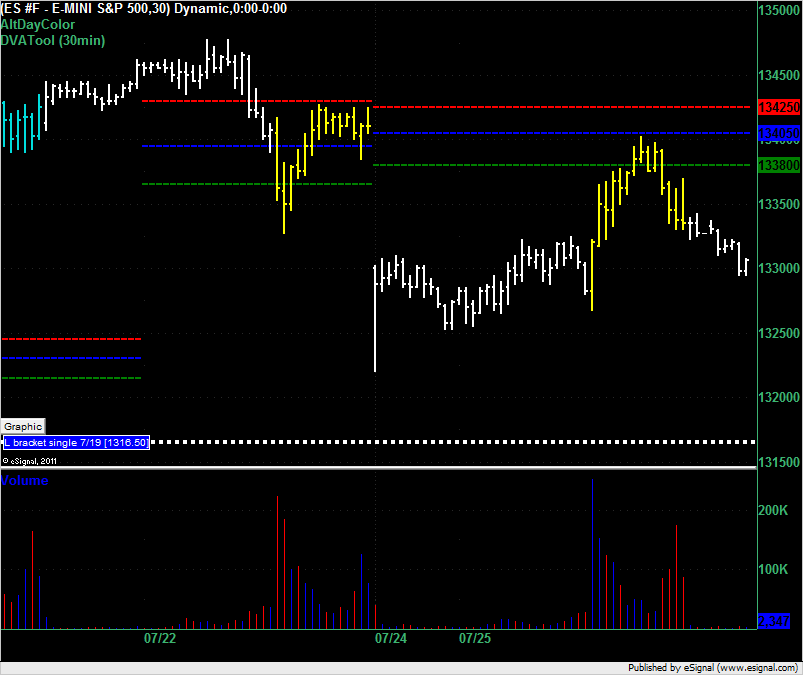
It's 8:30 Central Time that I snapped this pic of my 30min PASR chart (all trading hours) with the Blue lines potential significant "zones" with the White dashed lines as Wkly Pvts. Expected the overnight open to gap down obviously ... and scalped a couple of points long (3 trades - 1 loss, 2 profitable) fwiw ... wanted to just get long and hang on but the price action overnight was scattered ... and am just gonna stand aside until closer to the RTH's. It's my usual "map" ... which may be something less reliable with the s&i+ going on politically in Washington on the debt etc. ... dunno. Anyway, hope some find this helpful coming into the trading day Monday, whether trading the ES or equities!
Also, have some Volume Profile charts of different time frames on the following post.
Click image for original size
Also, have some Volume Profile charts of different time frames on the following post.
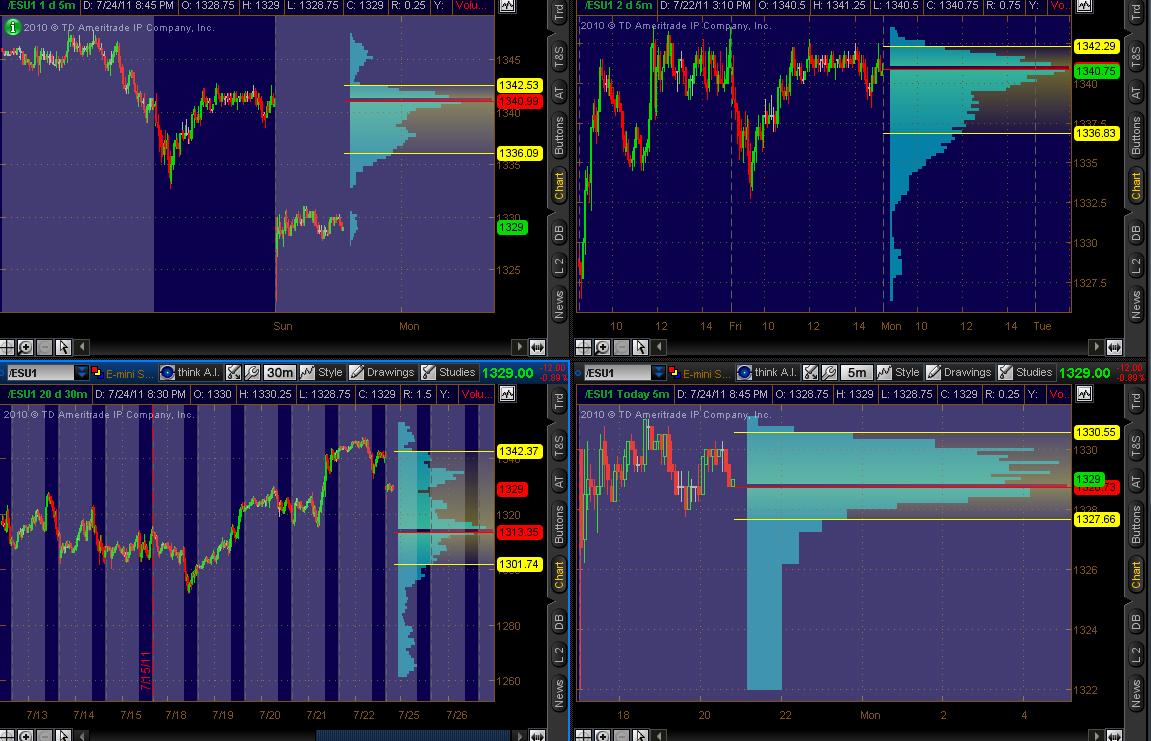
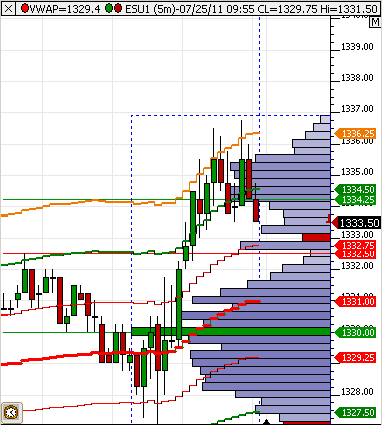
Volume Profile Charts
Top Left: 1 day 5min chart of all trading hours
Top Right: 2 day 5min chart of RTH
Bottom Left: 20 day 30min chart of all trading hours
Bottom Right: Today's 5min chart beginning overnight
(The Volume Profile is displayed on the right axis, Blue bars)
Bruce/Lorn and others have me hooked on Volume Profile ... has helped my own analysis, especially for finding where price should be attracted as a "target" as Bruce has explained in multiple posts over the past months/years.
Top Left: 1 day 5min chart of all trading hours
Top Right: 2 day 5min chart of RTH
Bottom Left: 20 day 30min chart of all trading hours
Bottom Right: Today's 5min chart beginning overnight
(The Volume Profile is displayed on the right axis, Blue bars)
Click image for original size
Bruce/Lorn and others have me hooked on Volume Profile ... has helped my own analysis, especially for finding where price should be attracted as a "target" as Bruce has explained in multiple posts over the past months/years.
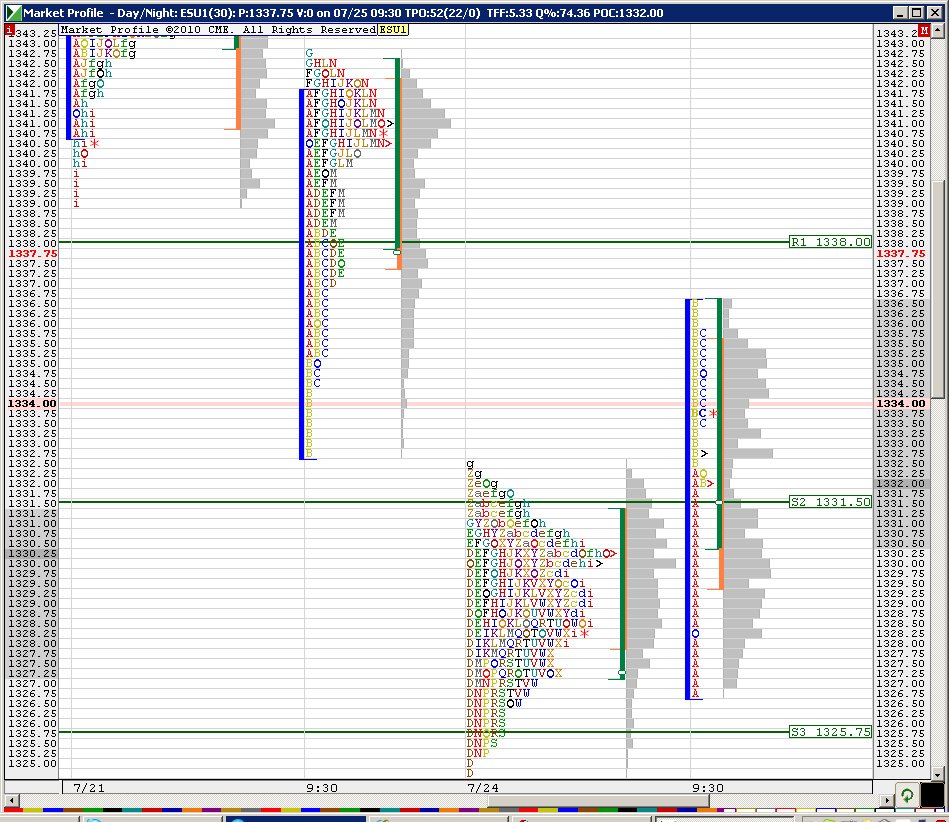
ES opens below Value Area so Market Profile theory will have you short the ES at 1338 even. There's also a single print under us from 7/19 so you would go long at 1316.50. Both of these would also be targets or partial targets if you were already in a position.
Click image for original size
OK, DT
thanks for making the MP observations.
I assume MP obs all based on RTH only 30minute slices.
I was looking at Volume based (24hr) from Friday and the VAL of V was/is 36.50
thanks for making the MP observations.
I assume MP obs all based on RTH only 30minute slices.
I was looking at Volume based (24hr) from Friday and the VAL of V was/is 36.50
Paul: correct, the MP comments are made based on 30 minute RTH brackets. The market profile that you see in the charts that I post are based on TPO's and not volume. i.e. they're not volume profile charts.
Paul, I asked a couple of MP"gurus" and they said they look at RTH 30-min charts only.
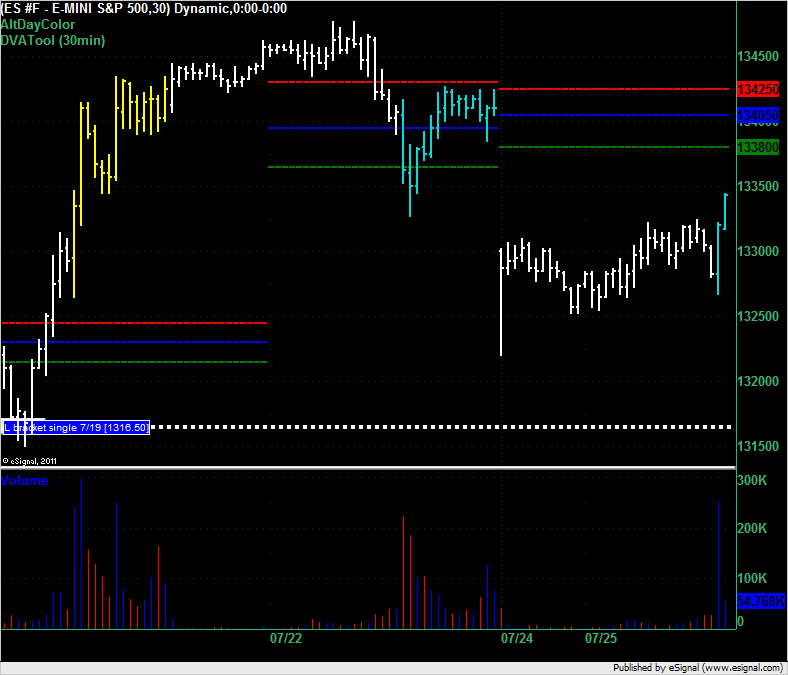
I find that in the morning it useful to look at O/N charts separately from RTH charts and set up one of mine accordingly. I find that often RTH price would test either O/N high/low or O/N value area. Here is that chart. Blue vertical line is RTH.
I find that in the morning it useful to look at O/N charts separately from RTH charts and set up one of mine accordingly. I find that often RTH price would test either O/N high/low or O/N value area. Here is that chart. Blue vertical line is RTH.
Click image for original size
Thanks,
I didn't mean to confuse anyone at all.
The definition you wrote about Market Profile explains MP beautifully, I have become interested in the volume profiles and wanted to mention that 36.50 level, but I also knew I should qualify that 36.50 level as the result of a volume profile that was constructed using 24hour data (as opposed to RTH Only)
BTW, volume-based VAL from Friday is 1337.25 on my chart, so I will get off my long there
low volume at 31.75 is my target off the failed 60 minute highs...gotta get a move on now
Click image for original size
ES high of the day was 1340.25 and the VAL was 1338 even. Had you shorted at the VAL you would have suffered a 2.25 point draw down and a best run up of 5 points to 1333 even. If you work with a 2 point stop then this trade would have been a loser.
Click image for original size
Emini Day Trading /
Daily Notes /
Forecast /
Economic Events /
Search /
Terms and Conditions /
Disclaimer /
Books /
Online Books /
Site Map /
Contact /
Privacy Policy /
Links /
About /
Day Trading Forum /
Investment Calculators /
Pivot Point Calculator /
Market Profile Generator /
Fibonacci Calculator /
Mailing List /
Advertise Here /
Articles /
Financial Terms /
Brokers /
Software /
Holidays /
Stock Split Calendar /
Mortgage Calculator /
Donate
Copyright © 2004-2023, MyPivots. All rights reserved.
Copyright © 2004-2023, MyPivots. All rights reserved.