ES Wed 7-27-11
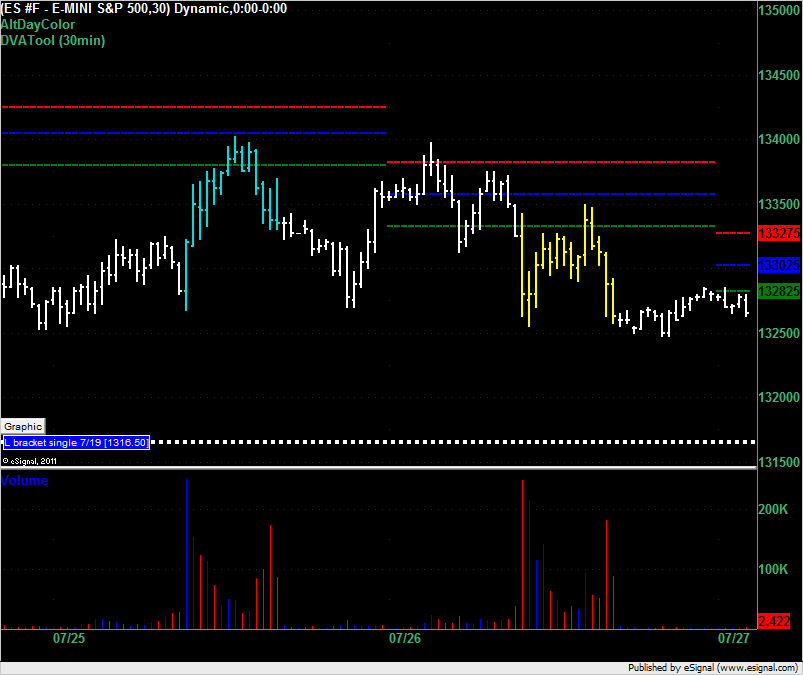
The VAL for the ES for trading on 27-July-2011 is at 1328.25. The overnight price has been hovering around here since this session started (white bars on right). Below us is the single print at 1316.50 from 7/19. Market Profile traders will be looking for longs at 1316.50 if we drop down there and if we open below the VAL will be looking to get short at 1328.25. If we open inside the value area we'll be looking for sideways trading but we have a very tight range of 4.5 points in the VA so we'd expect a breakout of that.
The Daily Notes page:
http://www.mypivots.com/dailynotes/symbol/445/-1/e-mini-sp500-september-2011
shows the average daily range to be between 17.00 and 19.50 points over the last 5 to 120 days so don't expect the price to stay inside the 4.5 point VA if it starts out in there.
The Daily Notes page:
http://www.mypivots.com/dailynotes/symbol/445/-1/e-mini-sp500-september-2011
shows the average daily range to be between 17.00 and 19.50 points over the last 5 to 120 days so don't expect the price to stay inside the 4.5 point VA if it starts out in there.
Click image for original size
Originally posted by prestwickdrive
Remembering Kool Blue, the Globex high of 1328.5 move to the Globex low of 1318.75 gave a full projection of 1303.0.
FWIW, the move from 1316.25 to 1310.0 gives a full projection of 1300.25. The initial projection was 1303.00.
Correction - initial projection of 16.25-10.0 was 06.5. Sorry about that.
vpoc from july 19 (local bottom formed this day in the 91 area) stands at 299 while vah from that day is 300.5, which coincides with the gap close lisa mentioned...i like taking a shot at longs again down in that area if time permits....below that comes 94 and 91-92, hopefully not all of them over the next 45min
good luck
good luck
long from 99.75...unloading all of it at 2.25, air fill
there is still a potential single print up at 06 for those who might want to target higher
done for day here...chau
there is still a potential single print up at 06 for those who might want to target higher
done for day here...chau
Originally posted by apk781
vpoc from july 19 (local bottom formed this day in the 91 area) stands at 299 while vah from that day is 300.5, which coincides with the gap close lisa mentioned...i like taking a shot at longs again down in that area if time permits....below that comes 94 and 91-92, hopefully not all of them over the next 45min
good luck
On this chart:
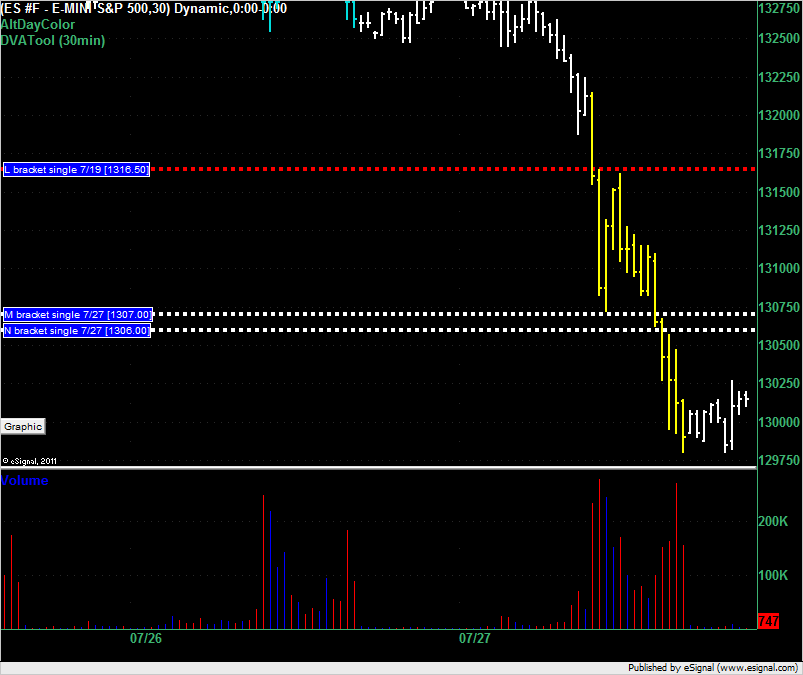
Single print long at 1316.50 that failed this morning. Dotted red line. The DVATool indicator changes the line color from white to red once the price has touched it indicating that it has been "used."
Note that 5 brackets into the day the failed single print that was supposed to provide support now provides resistance. I have no idea if this is watched by Market Profile practitioners. Does anybody know if failed singles are subsequently used in the opposite direction?
After that we have two new singles that were created in the M and N brackets today at 1307 and 1306 even respectfully. It's unusual to have singles this close together and in my opinion they should be treated as one. A strategy that could be used here would be to short half your position at 1306 and add the other half at 1307 with a stop at 1308 or 1308.50.
What do others think of that idea?
Click image for original size
"what do others think of that idea?"
sounds fine to me,
in my "old school" view of the markets, right now, markets are weak due to uncertainty about the debt ceiling.
If a headline of resolution comes in, I would disregard taking shorts at 06 or 07 and expect a "buy the news" event. As shorts cover, squeezing other shorts who are slow on the trigger finger.
I would expect a minimum of a 16 print (because last week's RTH only 50% of the weekly range was 1317.25)
Headline of resolution can easily vault prices all the way to Bruce's 23-25.
1325 is weekly pivot point (based on last week's RTH PA)
but this kind of volatile PA can easily create spikes and reversals
Emini Day Trading /
Daily Notes /
Forecast /
Economic Events /
Search /
Terms and Conditions /
Disclaimer /
Books /
Online Books /
Site Map /
Contact /
Privacy Policy /
Links /
About /
Day Trading Forum /
Investment Calculators /
Pivot Point Calculator /
Market Profile Generator /
Fibonacci Calculator /
Mailing List /
Advertise Here /
Articles /
Financial Terms /
Brokers /
Software /
Holidays /
Stock Split Calendar /
Mortgage Calculator /
Donate
Copyright © 2004-2023, MyPivots. All rights reserved.
Copyright © 2004-2023, MyPivots. All rights reserved.