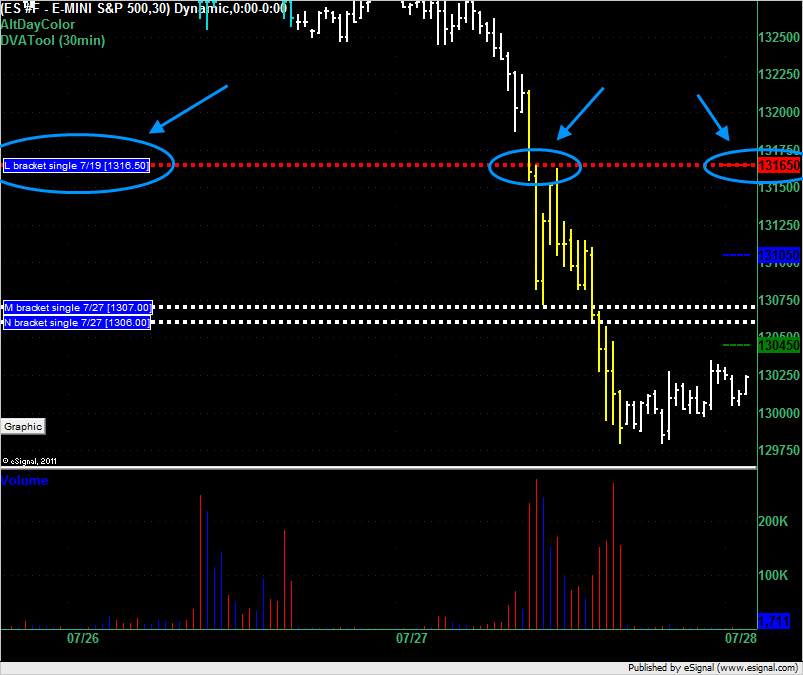
ES Thu 7-28-11
Interesting how yesterdays failed support at 1316.50 became resistance and tomorrow will be the VAH. This number keeps popping up. It's 1:46am as I type this and the market looks like it might open below the Value Area tomorrow. Good luck everyone.
Click image for original size
first decent volume
Click image for original size
Originally posted by apk781
dt, i have 307 as val and i know it differs from yours but just wanted to point that out...
based on that, along with the single prints in the 306 and 307 levels, the initial projection of the move from o/n low to 302.5 (yielding 6.75), the 1.618 of the stretch and s1 at 308ish, i took the short at 307, looking to get down to the 304.5 area, 5min air fill (just filled)
as you can see lots of hurdles in that area for a rather choppy market to get through with no exogenous impulse
my next area up also matches bruce's 10.5-12, with the poc from yesterday and multiple projections taken from the recent 3 lows (95.75, 97, 99.5) also falling in that area
good luck
apk - Could you please explain why your process yielded a VAL of 07 compared to Day Trading's 04.50? Thanks.
Originally posted by Lisa P
first decent volume
Click image for original size
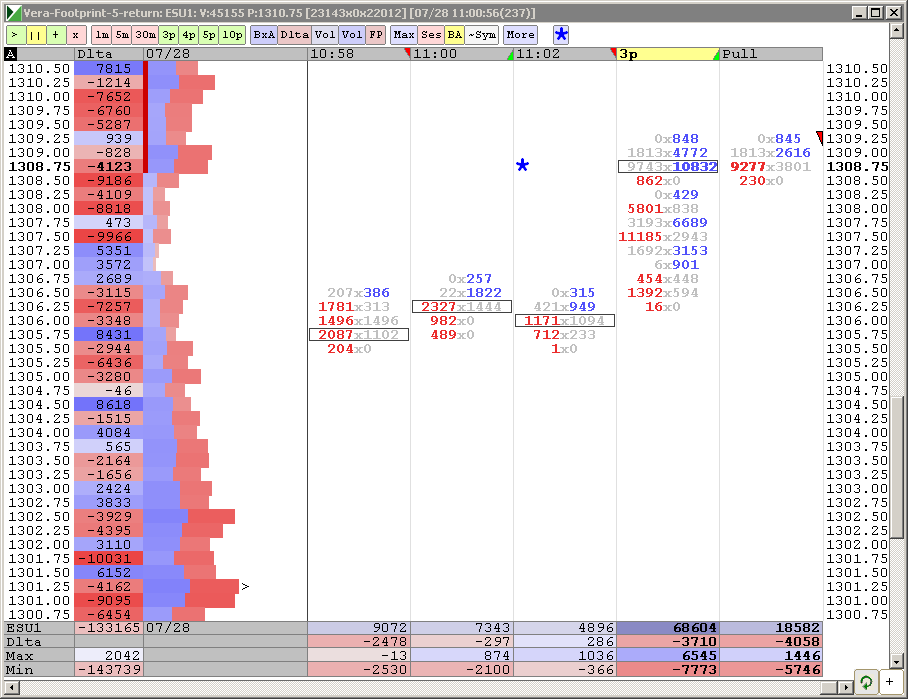
Trying to get up to speed on Market Delta and I have question. Why is the blue volume of 10,800 considered [email protected] when the 7.50 had 11,000 sellers with a greater buy/sell imbalance?
Thanks for the chart.
ross i am afraid i don't have an answer; i don't do the calculations, i just take whatever my charting package throws at me; fyi i use sierra charts, and you can plot tpo charts with most of the important stuff in them (value areas and poc included). I use dtn-iq as my data feed and i had never had such a big discrepancy up until today (somedays it is 0.25 different or so but never bigger than that). So that is all i can say.
Originally posted by Ross
apk - Could you please explain why your process yielded a VAL of 07 compared to Day Trading's 04.50? Thanks.
APK - Thanks for the reply. I appreciate the feedback. Data discrepancies are a routine topic here on the forum. Consistency with one's own system is what we all strive for. Good luck and continued success.
Originally posted by Big Mike
Originally posted by Lisa P
first decent volume
Click image for original size
Trying to get up to speed on Market Delta and I have question. Why is the blue volume of 10,800 considered [email protected] when the 7.50 had 11,000 sellers with a greater buy/sell imbalance?
Thanks for the chart.
Good question, Mike.
1. At 1307.50 there indeed was a significant imbalance, and someone shorted properly at yesterday's "kernel" of a volume, though not as calculated by the market profile. However, by that time we already succesfully tested O/N high and had that as a support; had a support of today's POC and were in general uptrend on all three markets. In addition NQ at that time "took out" its volume "kernel" and those shorts needed to cover.
2. Also please compare total volume at 1307.50 and 1308.75. Though there was a "Fight" on ES-front, YM was at that time moving in a "single print" area with a momentum.
3. I believe your government will resolve their differences soon, though at the 11th hour, market is oversold and need a bounce. This "ant walk" is usually bullish.
4. Having said all that, I took two shorts, at very same places as Mr. BigWig tried, but kept my stops very small, as I was trading against the "primary move" with other markets moving in a void.
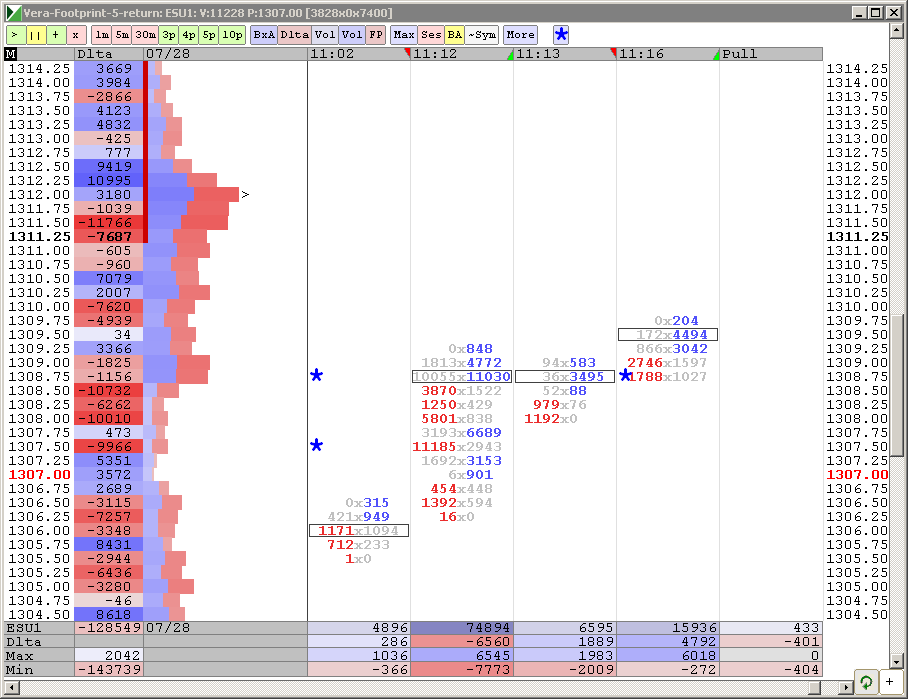
Hope that helps. Updated chart is below, so you can see the development of the numbers shortly after the first one was taken.
Click image for original size
Originally posted by Big Mike
Originally posted by Lisa P
first decent volume
Click image for original size
Trying to get up to speed on Market Delta and I have question. Why is the blue volume of 10,800 considered [email protected] when the 7.50 had 11,000 sellers with a greater buy/sell imbalance?
Thanks for the chart.
Good question, Mike.
1. At 1307.50 there indeed was a significant imbalance, and someone shorted properly at yesterday's "kernel" of a volume, though not as calculated by the market profile. However, by that time we already succesfully tested O/N high and had that as a support; had a support of today's POC and were in general uptrend on all three markets. In addition NQ at that time "took out" its volume "kernel" and those shorts needed to cover.
2. Also please compare total volume at 1307.50 and 1308.75. Though there was a "Fight" on ES-front, YM was at that time moving in a "single print" area with a momentum.
3. I believe your government will resolve their differences soon, though at the 11th hour, market is oversold and need a bounce. This "ant walk" is usually bullish.
4. Having said all that, I took two shorts, at very same places as Mr. BigWig tried, but kept my stops very small, as I was trading against the "primary move" with other markets moving in a void.
Hope that helps. Updated chart is below, so you can see the development of the numbers shortly after the first one was taken.
Click image for original size
While i was typing ES took out yesterday's "kernel", so a rotation here is possible
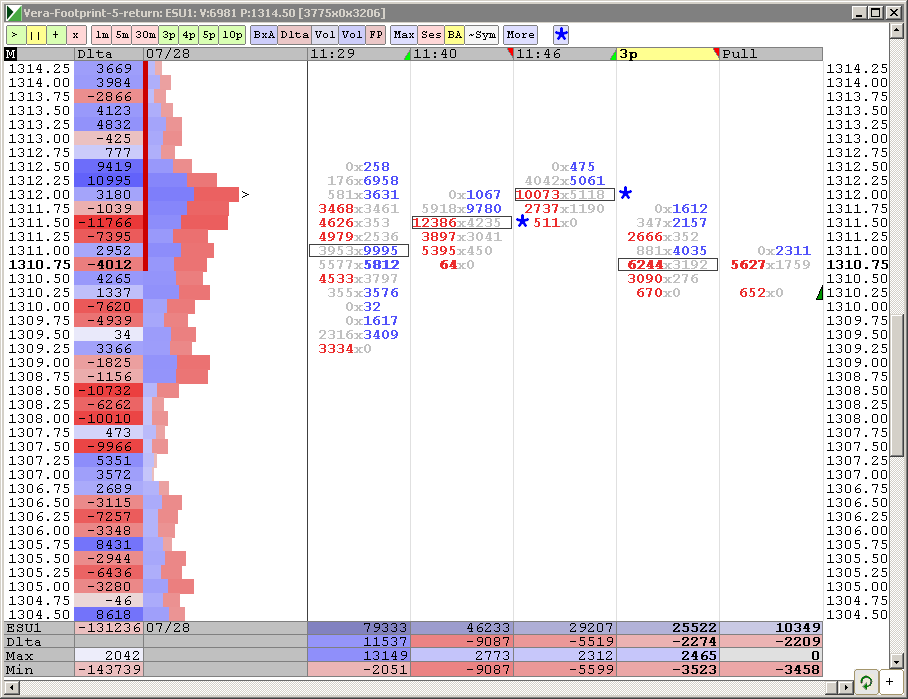
and here are the sellers
Click image for original size

and here are the sellers
Click image for original size
Thanks Lisa!
Not sure how I posted twice - weird. Sorry.
Interesting day for Market Profile single prints.
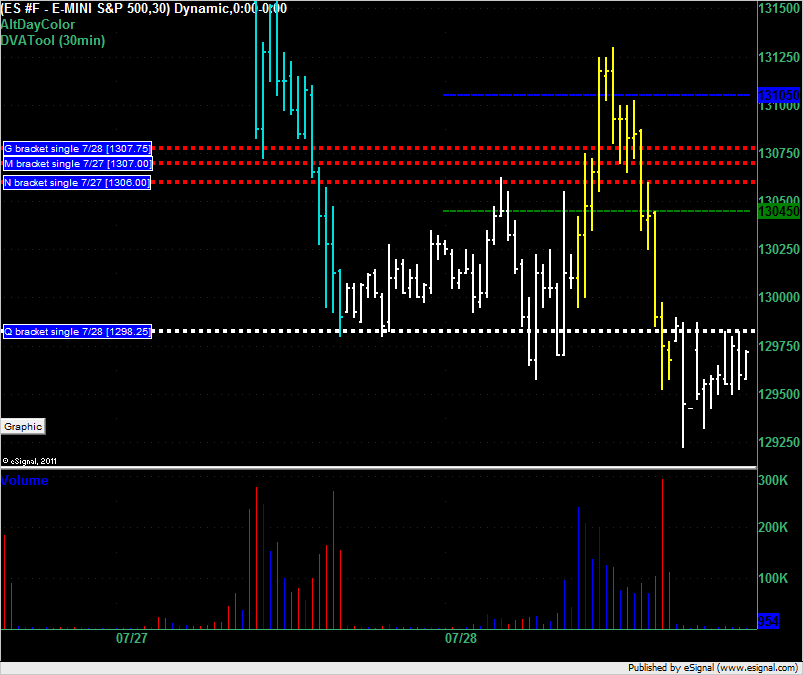
We started the day with the market rising and the single prints at 1306 and 1307 holding the market in check for a short while. The breakout to the upside then left a single print at 1307.75 which held the market with a worst case draw down of 1.25 points for 3 brackets (1.5 hours) before the market collapsed below it.
Right at the end of the day the market created a single print at 1298.25 and is now trading just under that.
Click image for original size
Emini Day Trading /
Daily Notes /
Forecast /
Economic Events /
Search /
Terms and Conditions /
Disclaimer /
Books /
Online Books /
Site Map /
Contact /
Privacy Policy /
Links /
About /
Day Trading Forum /
Investment Calculators /
Pivot Point Calculator /
Market Profile Generator /
Fibonacci Calculator /
Mailing List /
Advertise Here /
Articles /
Financial Terms /
Brokers /
Software /
Holidays /
Stock Split Calendar /
Mortgage Calculator /
Donate
Copyright © 2004-2023, MyPivots. All rights reserved.
Copyright © 2004-2023, MyPivots. All rights reserved.