ES Tue 8-9-11
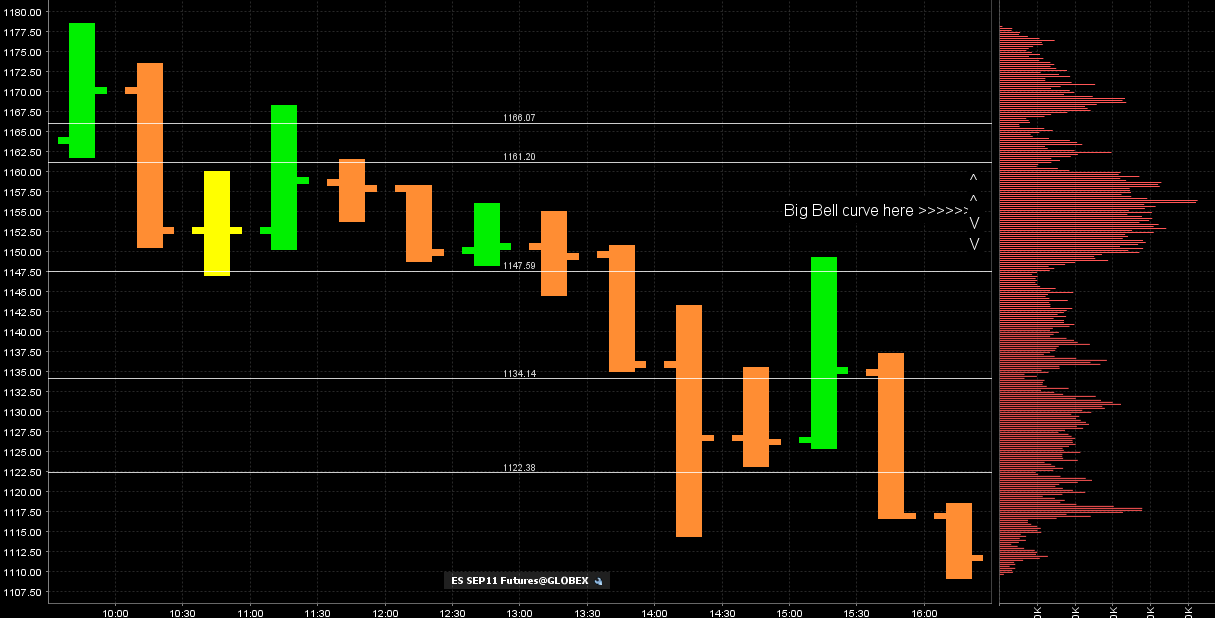
It's been a while for me posting. In this large volatility I have ONLY been trading at the low volume points on the chart. You will find that when these get broken from a previous day the market will very often come back to retest the area again. In other words the market will take some time to "fill in" the low volume zones.
The initial ones I used from Fridays trade where at 1168 , 1171 and 1176. These are not snapped off on my chart that I am posting here but you can see how the market respected them today early on.
I am always looking at what happens with my footprint chart at these zones. For example if I have a number at 1122.50 and we are approaching that number from below then I will look for sells in and around that number. If we don't reject the number immediately then we may pop up above it and I will continue to look for sells for the retest back down. News events are the hardest part and need to be approached with caution.
So with this big range from today we can see how the low volume prices I have snapped really only just separate miniature bell curves. That should be the real take away from this post.
Here are the low volume prices typed out and hopefully you can see them while looking at the volume histogram on the right.
1122.50
1134.25
1147.50
1161.25
1166
here is the chart:
Thanks for starting today's topic Bruce and welcome back! We've missed you!
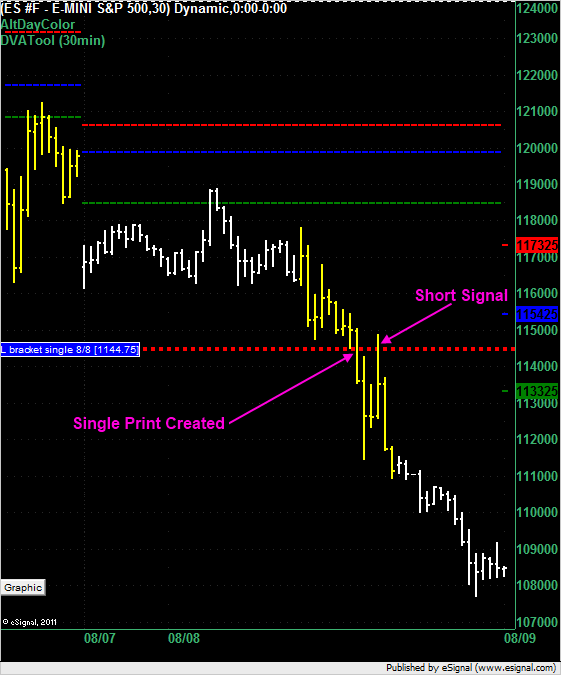
Quick summary from yesterday. There was a single print left in the L bracket at 1144.75. The market then dropped to 1114.75 (30 points!) before moving up to 1149 even triggering a short at the single print of 1144.75. Had you taken that short you would have either (1) been stopped out or (2) suffered through a 4.25 point draw down before the market moved down to a best run-up price of 1109.50 at the end of the day for a 35.25 point max possible (theoretical only) profit.
I did NOT take that trade and if I had I would have been stopped out. However, it's got me thinking that a big range before a single print entry might dictate a wider stop. Perhaps the stop loss formula for single prints is a function of day range versus average day range over last X days. (I just thinking out aloud now.) Say the range is twice as large as usually then you widen both your stop and target by twice their normal value. Anybody reading this do that?
good to see you posting again, Bruce.
something I wanted to point out, the SPX (CASH) printed very close to the 2009 yearly Close 1115.10. (likely spot for some short-term buying)
Big jump in VIX increases (for me) likelihood of
1) reflex rebound in price,
2) retest of the area of the Low that created the huge spike in VIX.
just look back over a daily chart that includes the VIX in a subplot and it is easy to see that large spikes in VIX can mean short-covering rally, but it also means that the markets will need time to confirm that all the "wanna be" sellers have sold (this need for confirmation can lead to multiple tests of lows and establishment of a base).
good luck trading to all.
remember Charter Joe's imperative of yesterday... smaller size larger stops.
1143.88 is 50% of the RTH range from yesterday.
very possible to see a shoot through and then go to print 54-56 area (Poc Vpoc)
so far, that 1144 has acted like resistnace which means there must be some stops sitting there for bears who shorted on first test.
very possible to see a shoot through and then go to print 54-56 area (Poc Vpoc)
so far, that 1144 has acted like resistnace which means there must be some stops sitting there for bears who shorted on first test.
jeez, this thing just keeps coiling below 50% of yesterday's range(lots of people betting in opposite directions keeping range small, sideways).
breakout might stall a little at AH H (48), but now, as long as 1144-1143 area acts like support, 1154 can easily be seen.
China says vice-premier spoke to Geithner on mkts, economy . China's Wen urges global action to calm mkts
If you are not trading, take a look at this. If this is true, S&P should be in trouble. OF course these MFs will never admit...
http://www.cnn.com/2011/OPINION/08/09/obama.right/index.html?hpt=hp_p1&iref=NS1
http://www.cnn.com/2011/OPINION/08/09/obama.right/index.html?hpt=hp_p1&iref=NS1
Using Kools Tools, the move off the Fed statement was 1144.5-1112.0. That gives an initial projection of 1092.0 and a full of 1059.25. These projections are valid until 1144.5 is hit again.
Emini Day Trading /
Daily Notes /
Forecast /
Economic Events /
Search /
Terms and Conditions /
Disclaimer /
Books /
Online Books /
Site Map /
Contact /
Privacy Policy /
Links /
About /
Day Trading Forum /
Investment Calculators /
Pivot Point Calculator /
Market Profile Generator /
Fibonacci Calculator /
Mailing List /
Advertise Here /
Articles /
Financial Terms /
Brokers /
Software /
Holidays /
Stock Split Calendar /
Mortgage Calculator /
Donate
Copyright © 2004-2023, MyPivots. All rights reserved.
Copyright © 2004-2023, MyPivots. All rights reserved.


