ES Thu 8-11-11
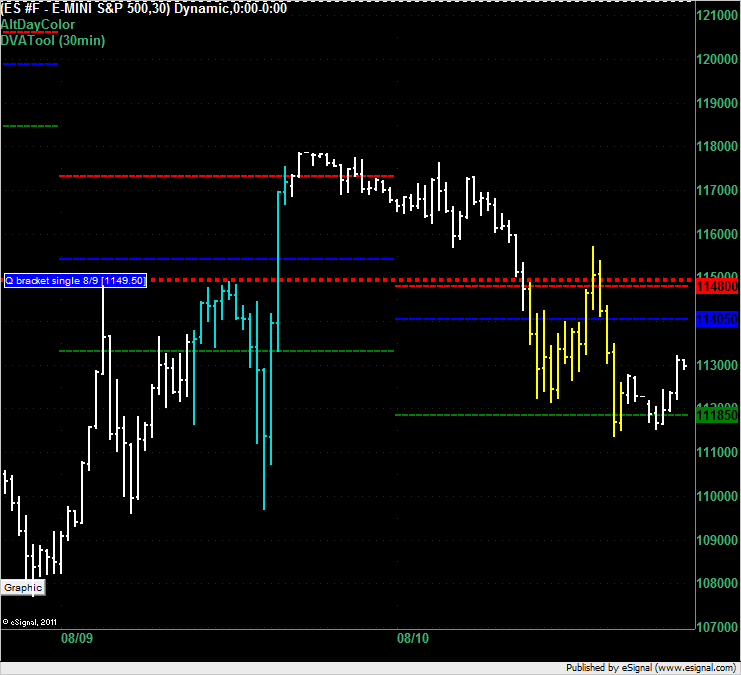
This is the ES at 8:30pm ET on Wednesday. On yesterday's ES topic I called a buy at 1148 or 1148.5 based on the single print and VAH but that call was nullified because we opened in the value area and the Initial Balance (IB) was formed inside the value area.
Market Profile theory looks for a day to be contained inside the value area when the IB is formed inside the value area. The market followed the theory and traded mostly inside in the value area and you will notice that the value area for today's trading is now, as a result, inside the previous day's value area.
Even though the market traded off the value areas it was, in my opinion, a truly scary market to trade off those lines with such fast markets and such a large range.
Have a look at the 5, 10, 20 and 40 day average ranges on this page:
http://www.mypivots.com/dailynotes/symbol/445/-1/e-mini-sp500-september-2011
We don't often see 70+ average ranges over 5 trading days.
Had you shorted the 1148 VAH on Wednesday you would have suffered through a 9 point draw down (or been stopped out) however the VAL target was only 1.5 points above the low of the day so you couldn't have wanted for a better target down there.
Click image for original size
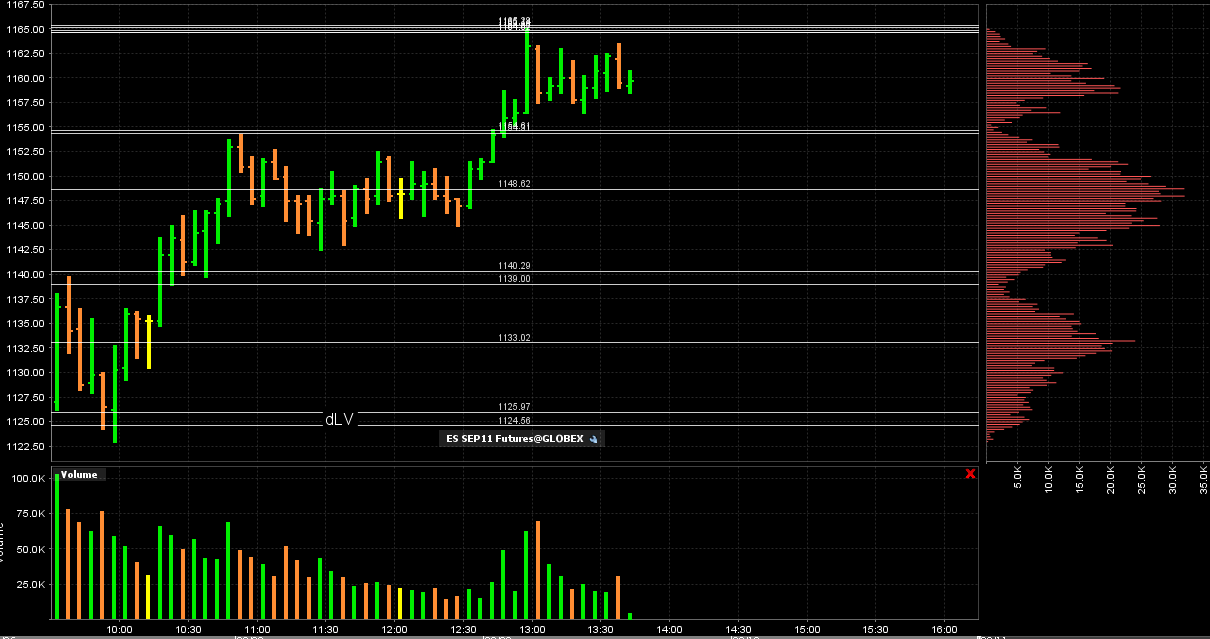
this may look like a mess to some but noticce the distinct bell shape distributions...beautiful structure today
Click image for original size
ah ok, if it is not too much trouble i would love to see a chart whenever you have a moment of what you were looking at (cum delta wise) when you entered that short around the 65 area
needless to say there is no rush at all
needless to say there is no rush at all
Originally posted by BruceM
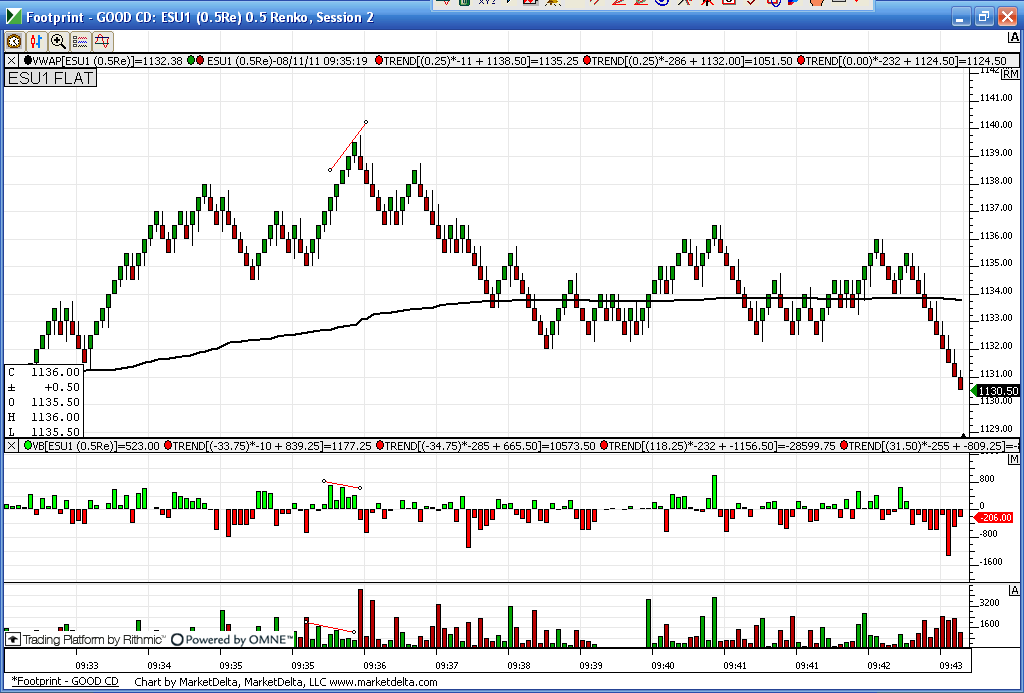
I use cum delta but not just for divergences...I like the pure flips in regular delta at key prices...
Nick,
Look at the run into the KEY number of 1165...we get less green pure delta into that number ( green histogram not as big) and CD has a nice tail....in fact the pure delta is barely viewable because it was so small into that high..hopefully more later
Look at the run into the KEY number of 1165...we get less green pure delta into that number ( green histogram not as big) and CD has a nice tail....in fact the pure delta is barely viewable because it was so small into that high..hopefully more later
Click image for original size
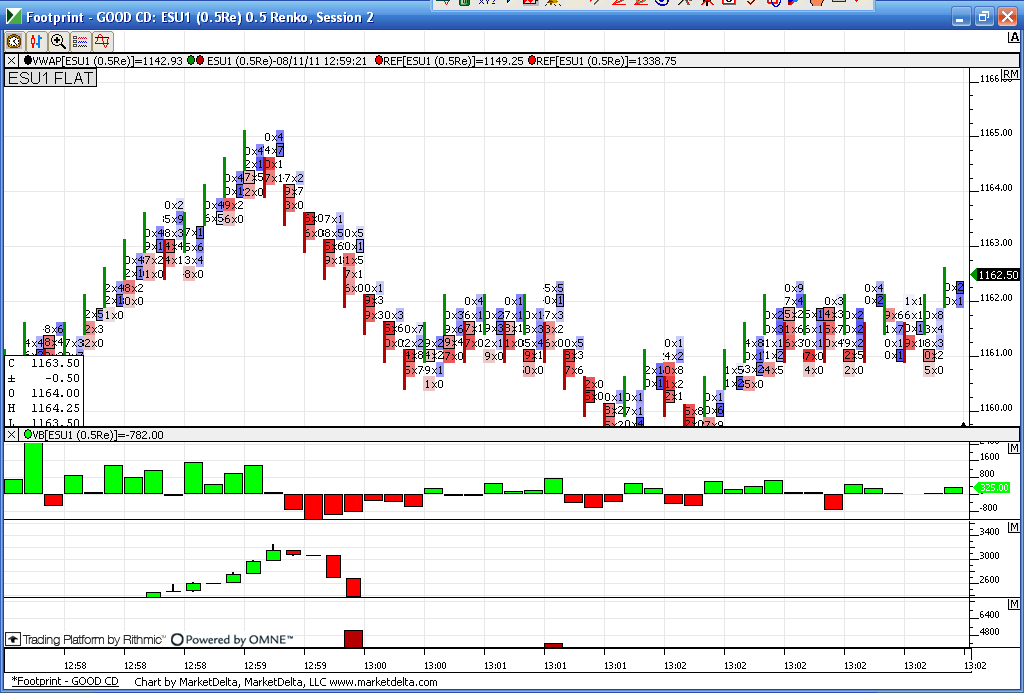
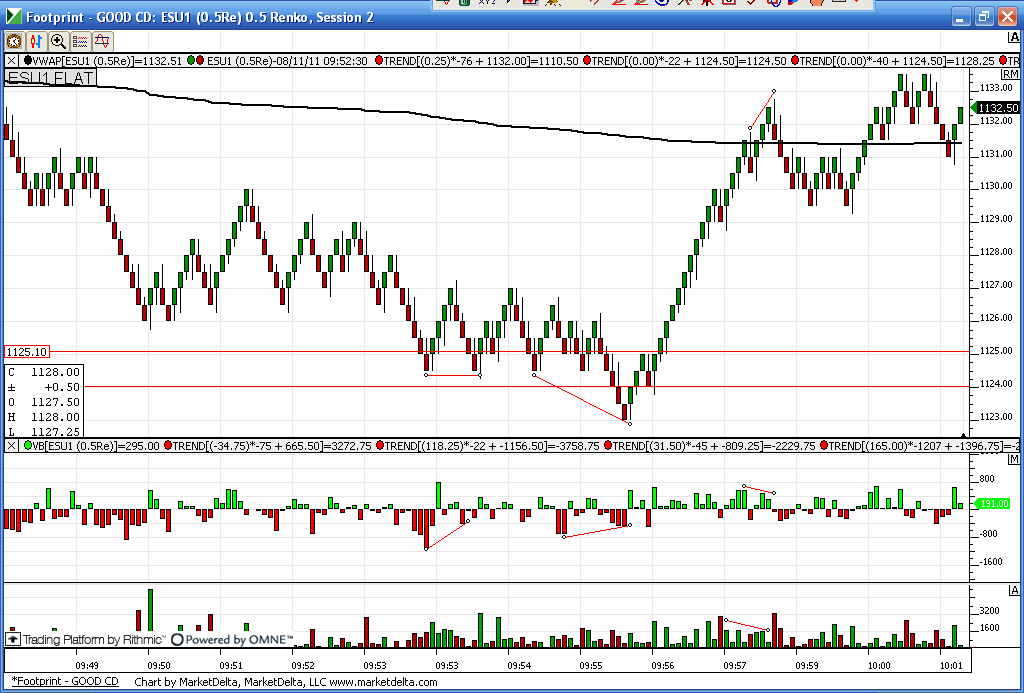
It took me two tries to buy under the key 55 area but note the divergence in the pure delta...I donot take signals in a vacuum ..u must have a key area...for me it is low volume
This is the same chart but not broken out with the footprint data...just a plain renko to help filter out noise
This is the same chart but not broken out with the footprint data...just a plain renko to help filter out noise
Click image for original size
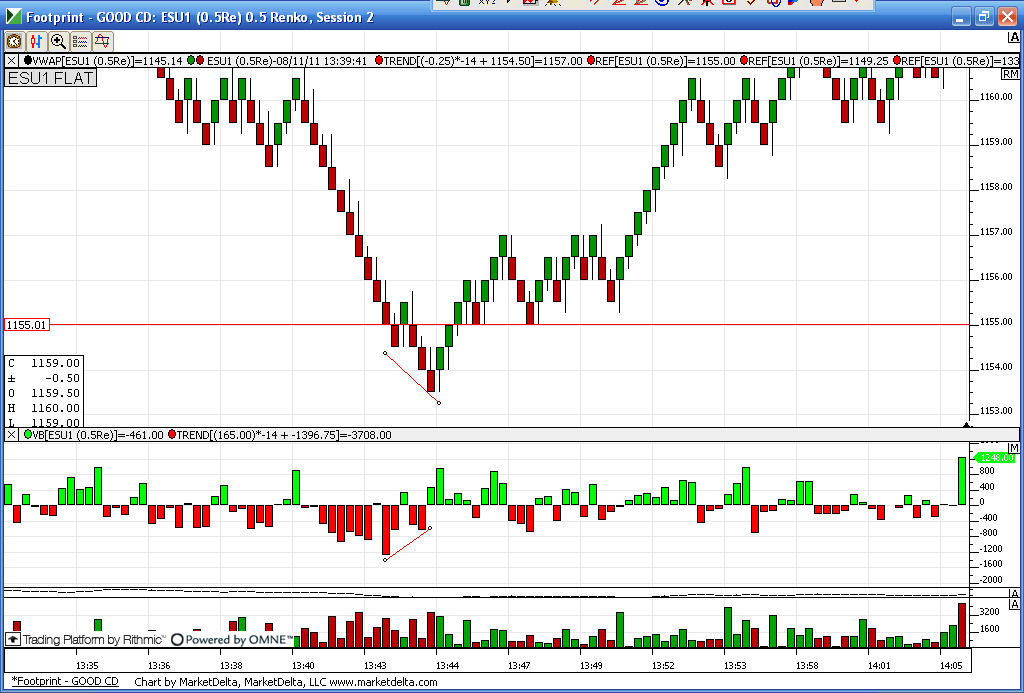
This morning I had a low volume area at 24 - 25. That also corresponded to the Va low and the previous close. How many tries would you take at your key areas before you get one to really take off ?
You can see the small loss or slight profit I had and you potentially would have before getting the good signal.....So you can trade in this volatility with tighter stops if you aren't afraid to take a loss and try again. I am not averaging in during these market days
here is the chart..I also marked off an exit I took up near vwap..
remember this: we want to put trades on in low volume in order to get back into high volume areas and distributions!!
Click image for original size
and why I sold above the key 37 run out early on today
Click image for original size
thanks for the multiple charts Bruce
i really appreciate it !
i really appreciate it !

Black lines - HVAs
Guys es moving up and is vol driing up?
not seeing alot up here
not seeing alot up here
80 is my last key number.....too late for me though
Emini Day Trading /
Daily Notes /
Forecast /
Economic Events /
Search /
Terms and Conditions /
Disclaimer /
Books /
Online Books /
Site Map /
Contact /
Privacy Policy /
Links /
About /
Day Trading Forum /
Investment Calculators /
Pivot Point Calculator /
Market Profile Generator /
Fibonacci Calculator /
Mailing List /
Advertise Here /
Articles /
Financial Terms /
Brokers /
Software /
Holidays /
Stock Split Calendar /
Mortgage Calculator /
Donate
Copyright © 2004-2023, MyPivots. All rights reserved.
Copyright © 2004-2023, MyPivots. All rights reserved.