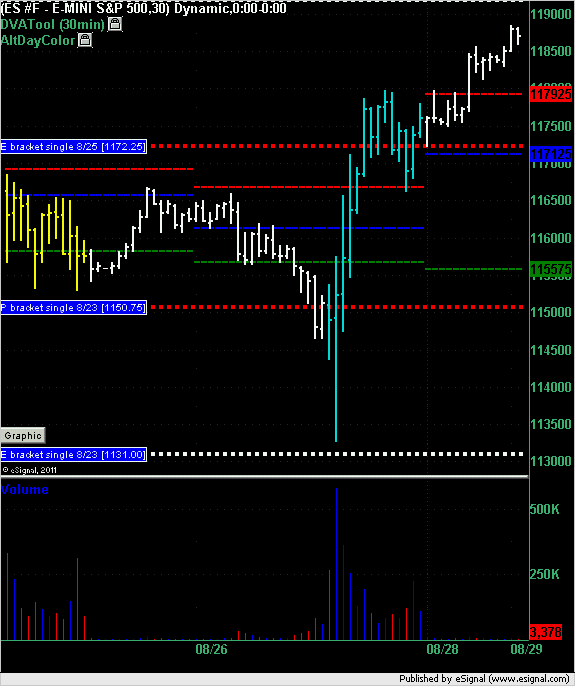
ES Mon 8-29-11
From Friday's session both of the single prints failed (thick dashed red lines on chart) and would/should have been stopped out at a loss. Let me know if you saw anything different for the single prints.
Sunday evening opening has the market trading above the VAH. If we stay up there and open above the VAH then this is a buy price if we come back down to it. As always confirm with other signals as I'm just summarizing a Market Profile strategy here. Way down below us is the 1131 even single print that's still alive.
Sunday evening opening has the market trading above the VAH. If we stay up there and open above the VAH then this is a buy price if we come back down to it. As always confirm with other signals as I'm just summarizing a Market Profile strategy here. Way down below us is the 1131 even single print that's still alive.
Click image for original size
No relief for trapped shorts yet.
Usually,one of two things occur. One is that there is a chance of being driven to cover at the days high at eod . The other is to cover into a high near the end of day and then watch as the correction begins into the eod low. Either one is nauseating.
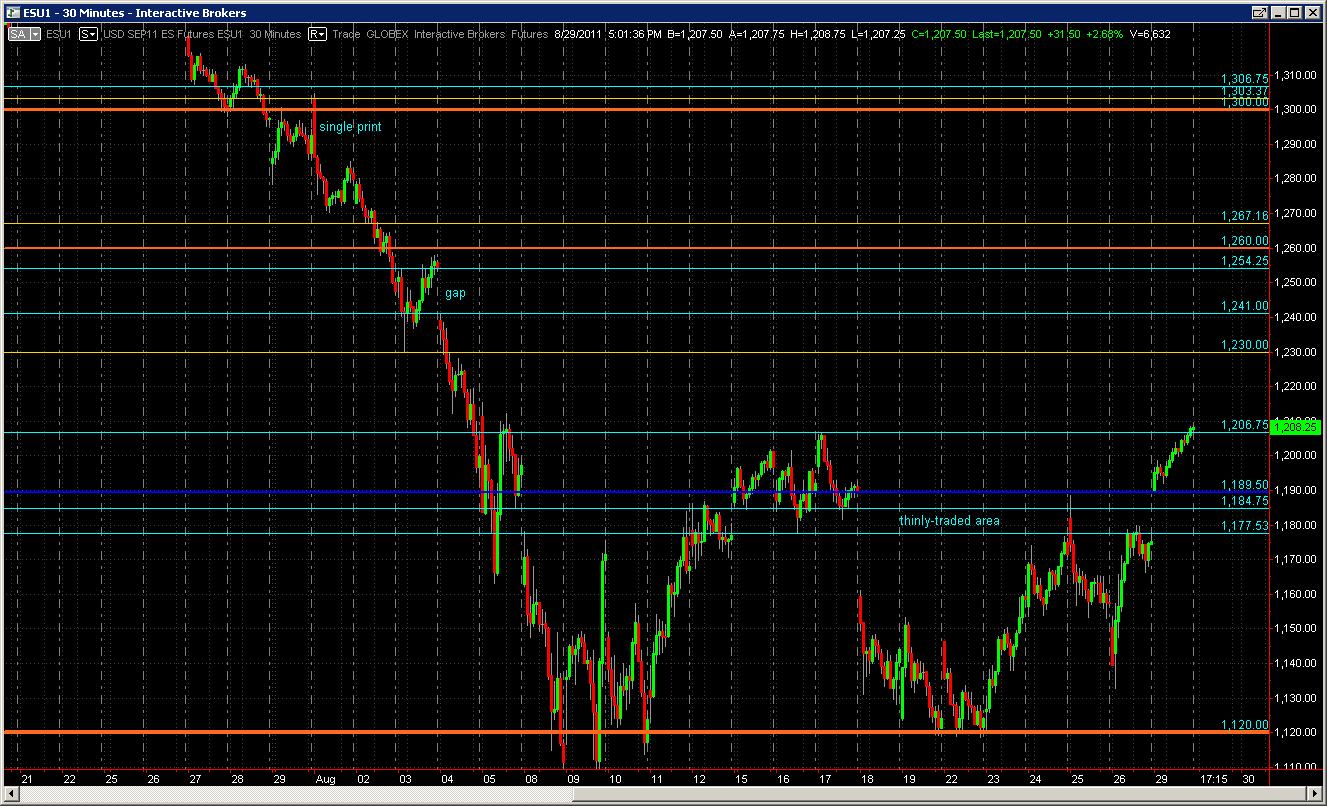
I was thinking it would pierce that high of 1206 and correct.
We'll see.
Usually,one of two things occur. One is that there is a chance of being driven to cover at the days high at eod . The other is to cover into a high near the end of day and then watch as the correction begins into the eod low. Either one is nauseating.
I was thinking it would pierce that high of 1206 and correct.
We'll see.
Closing thoughts. All major markets closed above previous "swing high" - bulish.
Here is $INDU.
http://stockcharts.com/h-sc/ui?s=%24INDU
Transportation average, however, closed below previous "swing high" - non-confirmation.
http://stockcharts.com/h-sc/ui?s=$tran
I expect a struggle day tomorrow because of the INDU and TRAN non-confirmation.
My train of thought is as follows:
- If $TRAN can take previous swing high, we probably will have major short covering at least to the gap fill on 08/04 (chart below) or to the end of the month (window dressing), whichever comes first...lol.
- If $TRAN drags $INDU down, I will be looking to trade to the thinly-traded area below (chart below)
So I will be watching transports tomorrow.
Consumer confidence report tomorrow at 10 will give us a sneak pre-view of the action.
Here is $INDU.
http://stockcharts.com/h-sc/ui?s=%24INDU
Transportation average, however, closed below previous "swing high" - non-confirmation.
http://stockcharts.com/h-sc/ui?s=$tran
I expect a struggle day tomorrow because of the INDU and TRAN non-confirmation.
My train of thought is as follows:
- If $TRAN can take previous swing high, we probably will have major short covering at least to the gap fill on 08/04 (chart below) or to the end of the month (window dressing), whichever comes first...lol.
- If $TRAN drags $INDU down, I will be looking to trade to the thinly-traded area below (chart below)
Click image for original size
So I will be watching transports tomorrow.
Consumer confidence report tomorrow at 10 will give us a sneak pre-view of the action.
Hi Lisa,
Thanks for your analysis. Are there any thinly traded areas above 1206 level in /es? and where do you see next major resistance above 1206 level.
Thanks for your analysis. Are there any thinly traded areas above 1206 level in /es? and where do you see next major resistance above 1206 level.
FWIW ... I've got 1219 and then 1229 as potentially significant resistance level ZONES give or take a point or two either side with the volatility and range of the recent market's price action.
Those two levels are Fib clusters of retracements/projections along with PASR on the hourly chart. Plus, there's a daily pivot or two in those same areas.
Just this monkey's 2 cents (sans charts this time).
Those two levels are Fib clusters of retracements/projections along with PASR on the hourly chart. Plus, there's a daily pivot or two in those same areas.
Just this monkey's 2 cents (sans charts this time).
Thanks for sharing your levels, Monkeymeat.
Emini Day Trading /
Daily Notes /
Forecast /
Economic Events /
Search /
Terms and Conditions /
Disclaimer /
Books /
Online Books /
Site Map /
Contact /
Privacy Policy /
Links /
About /
Day Trading Forum /
Investment Calculators /
Pivot Point Calculator /
Market Profile Generator /
Fibonacci Calculator /
Mailing List /
Advertise Here /
Articles /
Financial Terms /
Brokers /
Software /
Holidays /
Stock Split Calendar /
Mortgage Calculator /
Donate
Copyright © 2004-2023, MyPivots. All rights reserved.
Copyright © 2004-2023, MyPivots. All rights reserved.