ES Tue 8-30-11
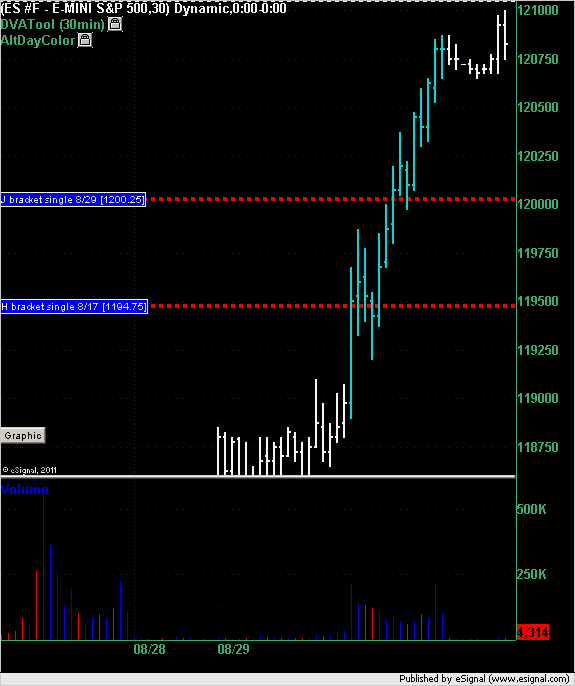
The chart below shows Monday's trading session in blue. There were 2 Market Profile single prints to trade off. The first was a short at 1194.75 from a single print created back on 8/17 in the H bracket. This was a loser and would have been stopped out.
The ES then created a single print in the J bracket at 1200.25. When the ES traded back down to this it would have triggered a long trade at that price and the draw down to 1199.75 would have been 0.5 points or 2 ticks. The best run up from this trade was to the high of the day of 1208.75 or 8.5 points.
Keep me honest. Are these summaries accurate?
Click image for original size
Hi daytrading,
Regarding single print of 1200.25 at J bracket, on Monday /es made an A up at 1200. Per Mark Fisher system, that's a level to go long and confirms bullish bias for the day.
Single Print strategy along with Mark Fisher system gives me more confidence in taking a trade.
thanks for sharing single print levels.
DT,
I don't trade MP....I like momentum more. Not much opp to short today....EW guys would say C wave.....straight up.
Can you explain to me what the basis is for trading a single print? If its too complicated no worries......
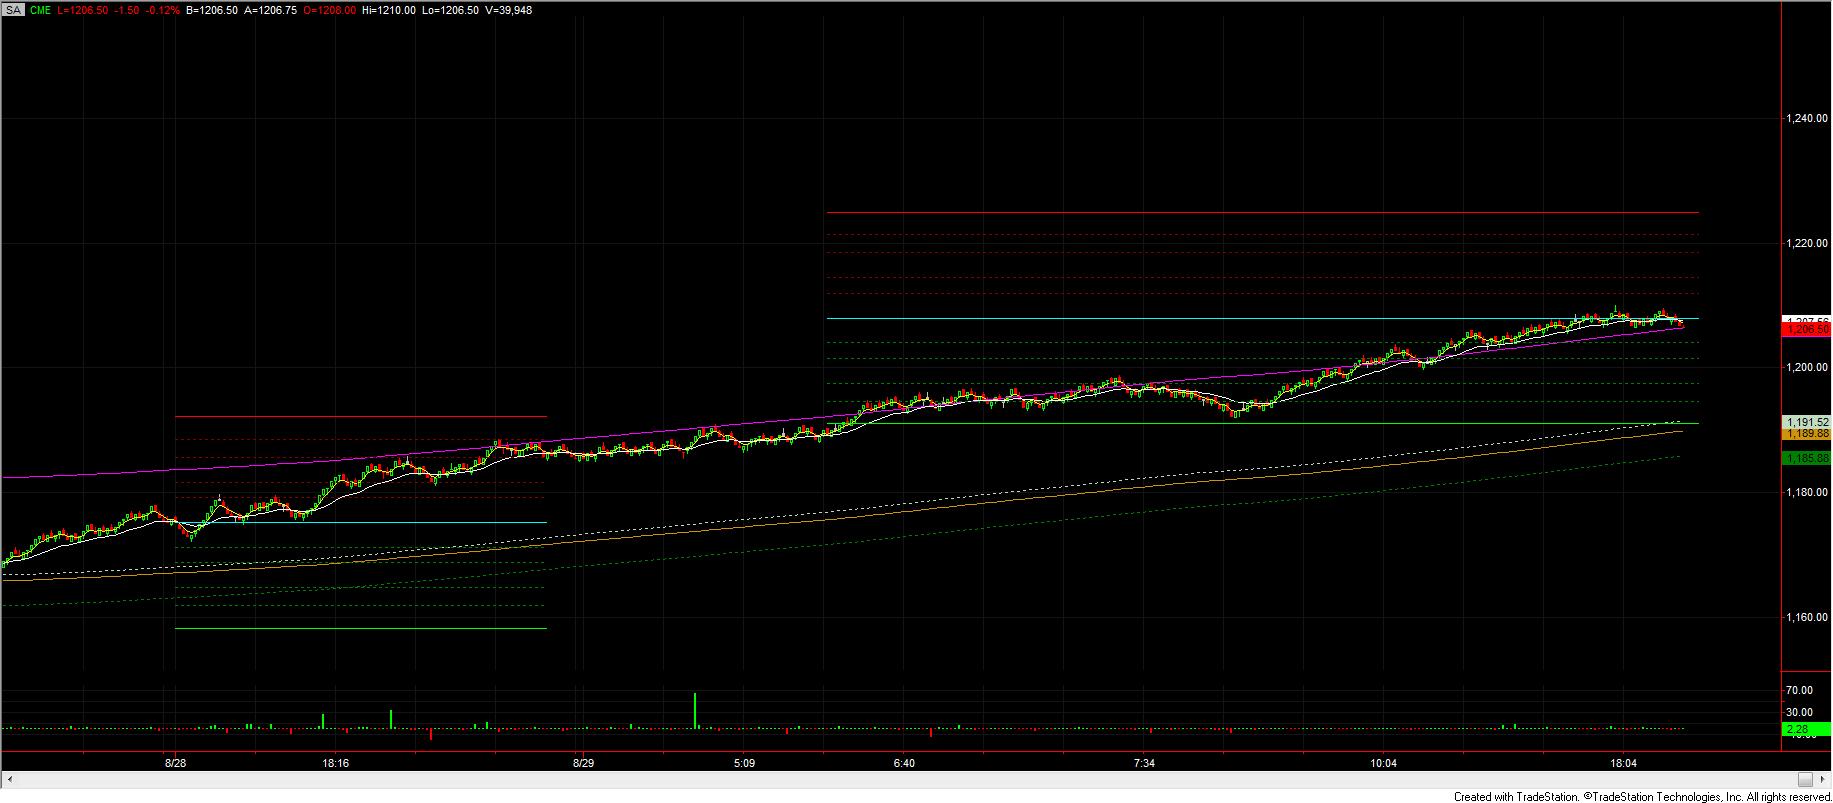
The reason I ask, is that I got the stretch calc from here and love it to death! Its now incorporated into our standards. Here's a PIC from last night&today with the stretch overlayed......where ES broke above the stretch (79.5) and never looked back. Very straight traj.
If ES doesn't crash though it.....the 86-91 range should be a good long.
Thanks
Good Luck,
I don't trade MP....I like momentum more. Not much opp to short today....EW guys would say C wave.....straight up.
Can you explain to me what the basis is for trading a single print? If its too complicated no worries......
The reason I ask, is that I got the stretch calc from here and love it to death! Its now incorporated into our standards. Here's a PIC from last night&today with the stretch overlayed......where ES broke above the stretch (79.5) and never looked back. Very straight traj.
If ES doesn't crash though it.....the 86-91 range should be a good long.
Thanks
Good Luck,
Click image for original size
@grednfer - I'm sure there are others who would like to know so here goes. First of all I assume that you understand what a single print is by following the link to the dictionary and reading the definition.
Single prints basically mark where there market has broken away from a previously accepted trading area. The single print price is the break-away price. This price then becomes support if the market moved up and it becomes resistance if the market fell and so the prices become counter-trend buy and sell prices if the market returns to these levels.
A simple single print strategy is to buy/sell at this price with a (say) 4 point stop and an 8 point target. Note that I haven't tested those stop/profit numbers and this is just a gut feel for the current market. If volatility drops then I would tighten the numbers.
Also I would suggest, as destiny pointed out in the previous post, to combine these buy/sell prices with other signals and look for a confluence of signals which the crowd are following. The more signals at price X the more traders you have pushing in your direction.
Sounds like a support/resistance indicator. I read the def, but it didn't explain how to compute, or identify it. I saw you used the 30M chart. Would it appear the same on different time frame charts or is it timeframe dependent....Just curious......
I do see sometimes within a block of volume that prices are attracted to the high volume price......like a rubber band. Do you find that MP works better in low volatility than high?......Its just that the market has been so binary lately......either straight up or straight down...
I do see sometimes within a block of volume that prices are attracted to the high volume price......like a rubber band. Do you find that MP works better in low volatility than high?......Its just that the market has been so binary lately......either straight up or straight down...
A little understanding of MP charts is needed to explain single prints.
Traditional MP charts are made by collapsing 30 minute bars to form a vertical histogram. Single prints are formed at the point were 30 minute bars do not overlap, creating what appears to be a "gap" in the histogram. Consequently, single prints always form somewhere midrange in the day's trading range.
One of the basic concepts of MP is that price moves by an auction process which results in a "rotating" effect to price action. Single prints are a consequence of price action, not a cause of it. They are traded like any other coincidental point on a chart.
Good explanation beyondMP. Single prints by definition will happen in low volume areas.
Originally posted by day trading
Good explanation beyondMP. Single prints by definition will happen in low volume areas.
Momentary low volume areas, perhaps, as "time at price" does not always equal volume.
Just came back to see this crazy ES chart. Then, as per my last night's post, looked at Transports. Aha.
http://stockcharts.com/freecharts/gallery.html?s=%24TRAN
http://stockcharts.com/freecharts/gallery.html?s=%24TRAN
So are there any single prints today?
My stuff took a long at 1196.25 but exited at 1213, which is weekly resistance(for a down trend).....thank god as its very heavy right now, but momemtum is still positive.
My stuff took a long at 1196.25 but exited at 1213, which is weekly resistance(for a down trend).....thank god as its very heavy right now, but momemtum is still positive.
Grednfer, there were 11:30 to 12:30
Originally posted by grednfer
ooooo That looks cool.....so the 96.25 trade was a single.
Q. Do you find that single print trades closer to the open work better than those later in the day?
A. Open time is tricky, there are many factors at that time. SO I am going to say it would be easier for you to trade singles mid-day.
Q. Do you see those right away? Like when they are occuring?
A. Yes, but you have to wait until 30-min bar is complete. Sometimes "singles" sit there for days before getting filled. When market comes back to them, you will see where the target is. Does not always mean market will stop there, but you would have to judge that yourself.
Q. Do you ever look at longer term timeframes, like dailys or weeklys....?
A. Yes. For example today I was watching TRAN daily chart for taking out previous swing high (see my last night's post)
Emini Day Trading /
Daily Notes /
Forecast /
Economic Events /
Search /
Terms and Conditions /
Disclaimer /
Books /
Online Books /
Site Map /
Contact /
Privacy Policy /
Links /
About /
Day Trading Forum /
Investment Calculators /
Pivot Point Calculator /
Market Profile Generator /
Fibonacci Calculator /
Mailing List /
Advertise Here /
Articles /
Financial Terms /
Brokers /
Software /
Holidays /
Stock Split Calendar /
Mortgage Calculator /
Donate
Copyright © 2004-2023, MyPivots. All rights reserved.
Copyright © 2004-2023, MyPivots. All rights reserved.