ES Wed 8-31-11
The following chart is from Tuesday's market action. No single prints created or hit. The VAL was almost a buy price but the market didn't quite hit it.
Click image for original size
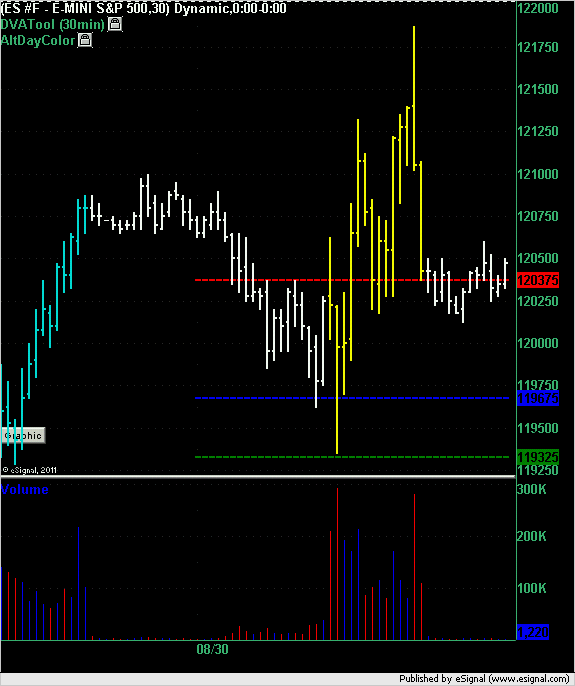
lots of stops ( targets ) sitting at 22.75 - 24.25
thanks for the target, Bruce
no problem Lisa...I'm just bailing on my last runner at 1219 ...that is open print and right near yesterdays highs....
Folks should take note how the low volume areas became resistance ...that happened at the 29 - 30 zone from the overnight of 8-04 and the 22.75 - 24 area....that was created intraday...
hope that makes sense
Folks should take note how the low volume areas became resistance ...that happened at the 29 - 30 zone from the overnight of 8-04 and the 22.75 - 24 area....that was created intraday...
hope that makes sense
that double 30 minute low shows no buying impulse and we just tested our low volume zone up here........
Click image for original size

Lisa,
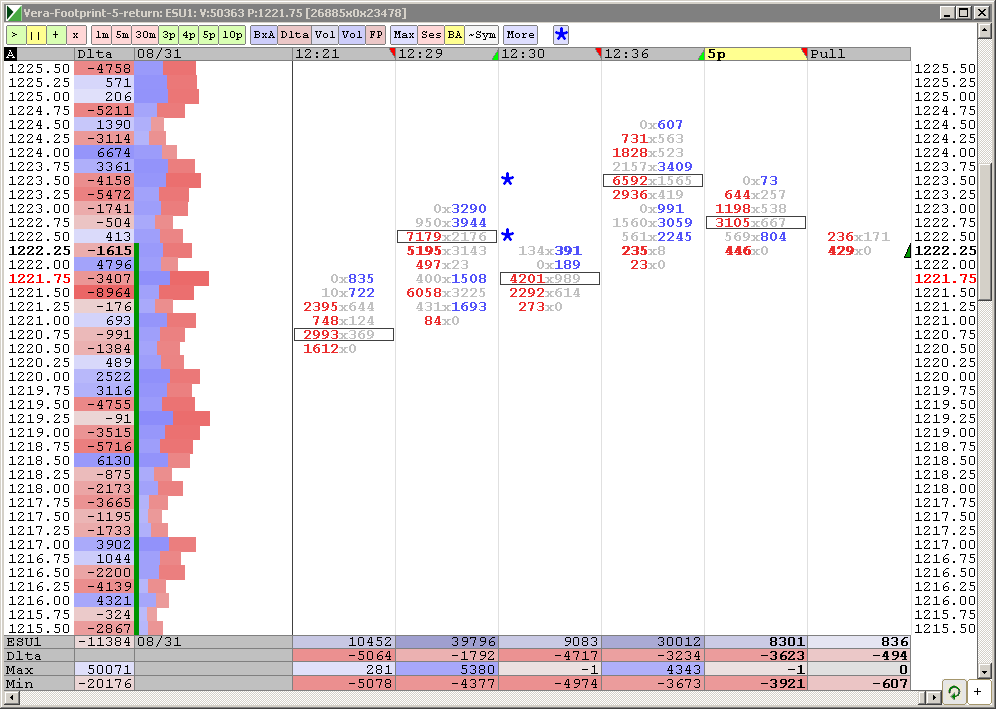
why do u look at a reversal type chart when all you are interested in is to see when the big buyers or sellers come in ? What added benefit does the reversal chart do for you....? Thanks...in advance
why do u look at a reversal type chart when all you are interested in is to see when the big buyers or sellers come in ? What added benefit does the reversal chart do for you....? Thanks...in advance
Bruce, I have learned that ES has a "standard wave" of 5 points. Tha makes a "deviation" equal 2.5 points and "noise" 1.25 points = 5 tics. According to the same source, if market retreats 5 tics that constitutes a "trend change". SO I chose 5-tic return for my chart.
Having said that, from the personal experience, these figures do not work in volatile markets or slow markets. In fast markets, waves could be 7.5 - 10 points, in slow - 3.75.
So the best thing would be to adjust the wave, deviation and noise figures to the market. I wish I had more screen real estate, than I would put separate Footpring charts for waves of 5, 3.75 and 10 points. It would be like changing gears to match the market speed.
I have an indicator written by a friend for returns of 2.5, 5, 7.5 and 10 points, it looks like the VWAP and its devviations on my VWAP chart. However, I have not put it in on my charts. Long weekend is coming - so maybe I will do it.
Hope I answered your question. If not, please buzz me on Skype...lol.
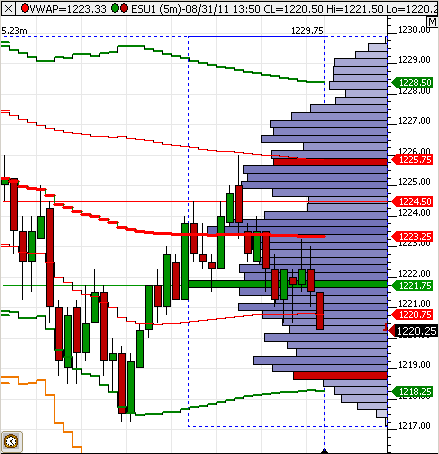
The following is VWAP chart with deviations. I credit Lorne for helping me in setting it us. THANK YOU , Lorne.
I assume that most of traders here are "visual" (I am). So having those deviations to watch is really helpful. That indicator looks the same - it tracks returns of 2.5, 5 , 7.5 and 10 from the last pivot (both high and low). I should put it on the chart, but have to figure it out. The indicator is for TradeStation and not for Market Delta. If there is a programmer, who can do it for Market Delta, I would like to connect.
Here is that VWAP deviation chart
Click image for original size
Sorry, today fingers are faster than brain and I put up wrong chart. Here is the chart I wanted
Click image for original size
Emini Day Trading /
Daily Notes /
Forecast /
Economic Events /
Search /
Terms and Conditions /
Disclaimer /
Books /
Online Books /
Site Map /
Contact /
Privacy Policy /
Links /
About /
Day Trading Forum /
Investment Calculators /
Pivot Point Calculator /
Market Profile Generator /
Fibonacci Calculator /
Mailing List /
Advertise Here /
Articles /
Financial Terms /
Brokers /
Software /
Holidays /
Stock Split Calendar /
Mortgage Calculator /
Donate
Copyright © 2004-2023, MyPivots. All rights reserved.
Copyright © 2004-2023, MyPivots. All rights reserved.