ES Tue 9-6-11
The chart below is from Friday's trading session. The market created a single print in the M bracket at 1175 even and then triggered a short in the last 45 minutes of the day at that price. The market rose to 1176.75 for 1.75 point draw down and then ran up to a best possible profit of 8.25 points at the low of the day 1168.50.
Anybody not trading that single print could be forgiven because it was so late into the day going into the Labor Day holiday weekend.
Anybody not trading that single print could be forgiven because it was so late into the day going into the Labor Day holiday weekend.
Click image for original size
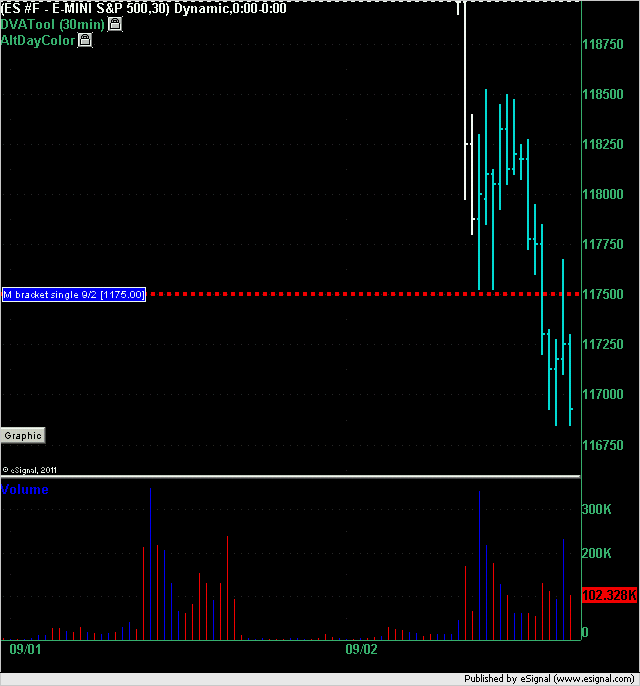
Friday single print level of 1175 is another example of how one can combine single prints with their system to trade.
On Friday, /ES made an A down at 1172. Opening range low was 1175. Price kept on failing at 1175 after bouncing from 1168 -1169 level.
Per ACD system, short was in order at 1175. My short was at 1175 with 1177 stop loss. Covered at 1169 into the close.
On Friday, /ES made an A down at 1172. Opening range low was 1175. Price kept on failing at 1175 after bouncing from 1168 -1169 level.
Per ACD system, short was in order at 1175. My short was at 1175 with 1177 stop loss. Covered at 1169 into the close.
Nice trade destiny. Any chance you can post a chart with the ACD marked on it showing where we could have seen the signals at the time the market was developing? Thanks.
Hi DT,
Which software you use to post your charts? I am trying to figure out how to post charts.
Thx
Which software you use to post your charts? I am trying to figure out how to post charts.
Thx
I have another question, thx in advance.
The manual trading that I do is based on weekly data.
For example last friday was a long for me at 1175....with a target of 1220-30. 1228 was a short and I can't believe the market dropped 60 points and erased the entire week and closed down....which is really bad for bulls....closing below the weekly 200MA. They were about to recapture weekly positive momo.....but no no.
My question is do you think the market profile concept and associated trading software would be of benefit to me for weekly data analysis?
I have more than enough software at this point but would add to it if I could see benefit.
Can you generate a weekly ES chart and post it so I can look at it. If you are unable to do so, could you point me to a good example? I've looked on the web and can't find any.
Thanks.
One can find market profile charts on any trading instruments like /es at www.charthub.com for free.
Basically all kinds of traders post charts there e.g FT71 market charts are very detailed and he uses investor Rt.
Basically all kinds of traders post charts there e.g FT71 market charts are very detailed and he uses investor Rt.
http://www.charthub.com/images/2011/09/03/YTD_ES_MP
So this ES chart which is a year to date MP chart.....and I haven't been trained on how to read it.... tells me that the 1230-56 low volume area should provide resistance and the 1138 should provide support? Is that how one reads this?....in general?
The 1163 area ahould provide most immediate support?
How about the low volume area around 1152, would that be support as well?
I always keep in mind one of quotes of Jim Dalton- who has done the most work on Market/volume Profile over last 10 years or so " I am not a Market/ Volume Profile Trader".
My interpretation of what Jim Dalton is saying that Market Profile is not a trading system. What is does beautifully is to provide data in a 3 dimensional way.
I try to use context and Mark Fisher system along with different data/reference points provided by Market profile to execute a trade.
In general it seems that traders who rely exclusively on Market Profile tend to trade do very well in a side ways market compared to trending markets ( one time framing price action).
Here is a link which provides a primer on market Profile. http://www.clever-trading-strategies.com/primer_on_market_profile.html
1138.25 exactly. High volume area from the YTD MP chart......thats interesting. Wonder if it will hold.
Originally posted by destiny
Which software you use to post your charts? I am trying to figure out how to post charts.
The two sticky topics at the top of this forum should address your question:
http://www.mypivots.com/board/forum/4/1/charts
If they don't then post a reply to one of those topics and I'll clarify.
Thanks DT,
I will check the out. In the mean time, I am trying jing. Apparently, there is a way to post a live URL link which display an image. So far, i been able to figure out how to view a chart by copying link in your browser. So, here is over due chart from Friday. Two cyan lines represent OR for /ES between 9.30 to 9.50 am eastern time.
http://www.screencast.com/t/5waYgWQWeI
Originally posted by destiny
Thanks prestwickdrive for sharing. After reading your post, i looked into kool blue posts to get an understanding of these tools. Following is a note from one of kool blue posts. Looks like he is a scalper. My question to you is " Are you a scalper? or you use kool tolls to get maximum gains out of projected price levels".
" Predicting a turning point is frankly, not that difficult, but knowing if that turn will be 5 ticks or 500 is. That's why I'm a scalper . All I really care about is the next few minutes. Any way remember I commented on the cycles thread that I knew by around 10:15 that the market 'wanted' 984? Here's how that came about. Remember, the theory is that every initial move times 1.618 and added to the end of that initial thrust gives the point at which it will run out of gas so to speak."
Sorry for the delay in responding. I have been on the road and just saw your question. I scalp also and use the KT projectons as an aid for trade placement. If I could master better stop discipline I believe I could generate more trading profits by believing the KT projections and riding them for much more than a scalp. Perhaps someday ... :-)
Emini Day Trading /
Daily Notes /
Forecast /
Economic Events /
Search /
Terms and Conditions /
Disclaimer /
Books /
Online Books /
Site Map /
Contact /
Privacy Policy /
Links /
About /
Day Trading Forum /
Investment Calculators /
Pivot Point Calculator /
Market Profile Generator /
Fibonacci Calculator /
Mailing List /
Advertise Here /
Articles /
Financial Terms /
Brokers /
Software /
Holidays /
Stock Split Calendar /
Mortgage Calculator /
Donate
Copyright © 2004-2023, MyPivots. All rights reserved.
Copyright © 2004-2023, MyPivots. All rights reserved.