ES Monday 9-26-11
The numbers below are for Monday. The bold numbers are important S/Rs. the others are minor s/r. If you find congruency between the numbers posted below and the ones you got, and the market is trending in that direction, then it's most likely the market will hit it.
For Sep. 26. Monday
Buy above 1133.25
with 1137 / 1141.50 / 1145 / 1150 / 1154
Extreme 1158 /1162
as outside resistance and objectives.
Sell below 1128.75
with 1124 / 1120.25 / 1116.75 / 1112 / 1109
Extreme 1103 / 1095
as downside support and objectives.
As always, the market has the last word and in due time will show us the way.
I see for you the same I see for my self: having the very best of luck and a fun, awesome, profitable trading day!
with all that bearishness, INDU RTH chart actually looks bullish to me. We entered a thinly-traded area (gap)
Click image for original size
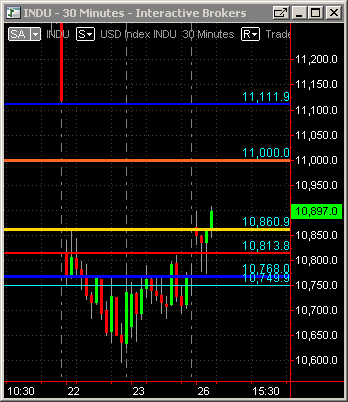
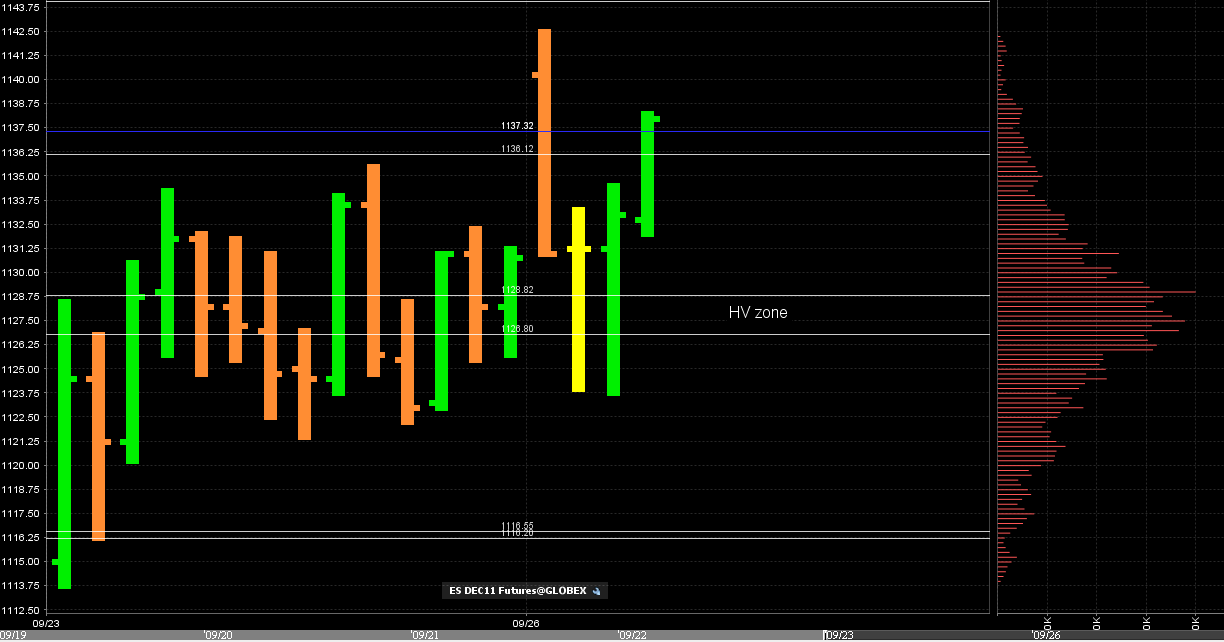
here is the two day bell curve...combining 3 days still gives same thing and the bulk of volume in the center at the 27 - 28 area...STILL
No doubt they are TRYING to break it out...but I don't "DO" breakouts.....so I will still look for signs to fade as the opening range is still holding price back ..getting above the opening range changes things a bit but certainly not to breakout mode for me.....still have that gap down at 25 and the 27 - 28 magnet....so shorts still valid...testing opening range as I type
No doubt they are TRYING to break it out...but I don't "DO" breakouts.....so I will still look for signs to fade as the opening range is still holding price back ..getting above the opening range changes things a bit but certainly not to breakout mode for me.....still have that gap down at 25 and the 27 - 28 magnet....so shorts still valid...testing opening range as I type
Click image for original size
Originally posted by BruceM
here is the two day bell curve...combining 3 days still gives same thing and the bulk of volume in the center at the 27 - 28 area...STILL
No doubt they are TRYING to break it out...but I don't "DO" breakouts.....so I will still look for signs to fade as the opening range is still holding price back ..getting above the opening range changes things a bit but certainly not to breakout mode for me.....still have that gap down at 25 and the 27 - 28 magnet....so shorts still valid...testing opening range as I type
Click image for original size
BRuce, would that be 5-min or 30-min opening range?
Nice charts people. Looking at them and my charts, now I can see that I missed the 1124 double bottom at support.
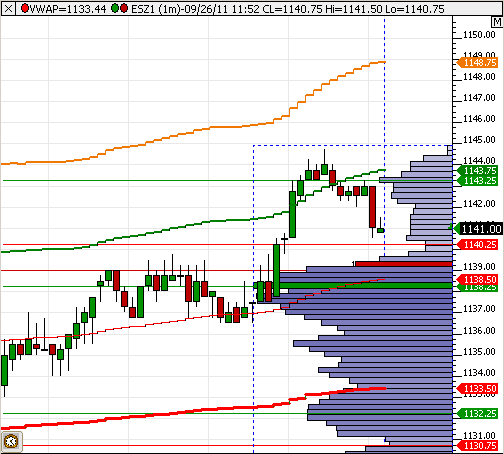
So far the ES has retraced 50% from the O/N/H and morning's low. It's also hit the O/N resistance trend line. (1140) Overcoming the trend line will target the overnight High at 1150. Resistance at 1144.00 If the set-up is there I will buy at 1140.50 for 1150 objective. will see.-.-
ES now trading 1137.25 @ 11:38
long at 1141.75. Just above the resistance. Stop 1140.75.
ES now trading 1143.50 @ 11:42
ES now trading 1143.50 @ 11:42
Here it comes 1144/5 resistance area. Moved stop up to B.E. 1141.75.
ES now trading 1142.75 @ 11:47
ES now trading 1142.75 @ 11:47
Stop out at B.E. 1141.75. --- I got to go for some coffee lol --- Got to get a good one today.
ES now trading 1141:00 at 11:52.
ES now trading 1141:00 at 11:52.
shorted into the 44 ...if u were here last week u know why.....36 area has triples and obviuos key price and ultimate target..gotta resolve opening range on the downside now
sandoxe, what is the point of you posting all your numbers if you cannot talk abt them because they are derived from a proprietary method ?
what do you expect people to get from them? there is no teaching or lesson involved so what is the point?
what do you expect people to get from them? there is no teaching or lesson involved so what is the point?
well since we are all making projections here and predictions I'm putting my prediction on the 52.75 retest.....above this 61.25 area though I have 67.75, 71.75 and the big number at 76.50...real close to what you folks have posted...these are all fade points ....assuming I was awake...
Emini Day Trading /
Daily Notes /
Forecast /
Economic Events /
Search /
Terms and Conditions /
Disclaimer /
Books /
Online Books /
Site Map /
Contact /
Privacy Policy /
Links /
About /
Day Trading Forum /
Investment Calculators /
Pivot Point Calculator /
Market Profile Generator /
Fibonacci Calculator /
Mailing List /
Advertise Here /
Articles /
Financial Terms /
Brokers /
Software /
Holidays /
Stock Split Calendar /
Mortgage Calculator /
Donate
Copyright © 2004-2023, MyPivots. All rights reserved.
Copyright © 2004-2023, MyPivots. All rights reserved.