ES Tuesday 10-4-11
I'm hoping to post these charts through the end of the week so we can see how these price distributions (bell curves) interact. The new user to this stuff should be concentrating on finding the key areas and drawing in the bell curves.
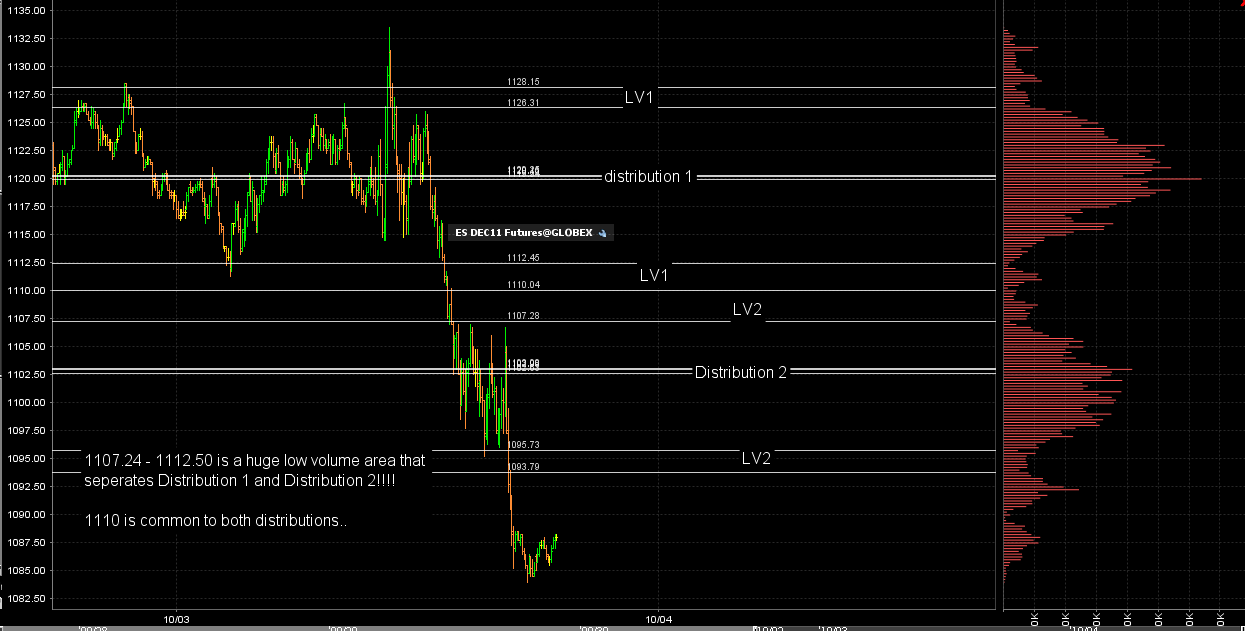
Today left us with two very distinct bell curves. A double distribution day separated by low volume in the middle. Viewers looking to get better should focus on the volume histogram and draw your high and low volume areas based on that without looking at the price bars.
Hopefully we will get an upmove overnight so we have something to work with in the RTH session tomorrow morning. We will formulate some trade ideas once we see which side of the bell curves price will be entering from in the morning.
It is my experience that highs and lows will form more often based off the low volume areas from previous days and not the high volume areas from previous days. This is opposite from what that Enthios site teaches and the natural true range method but as usual I encourage everyone to do their own research.
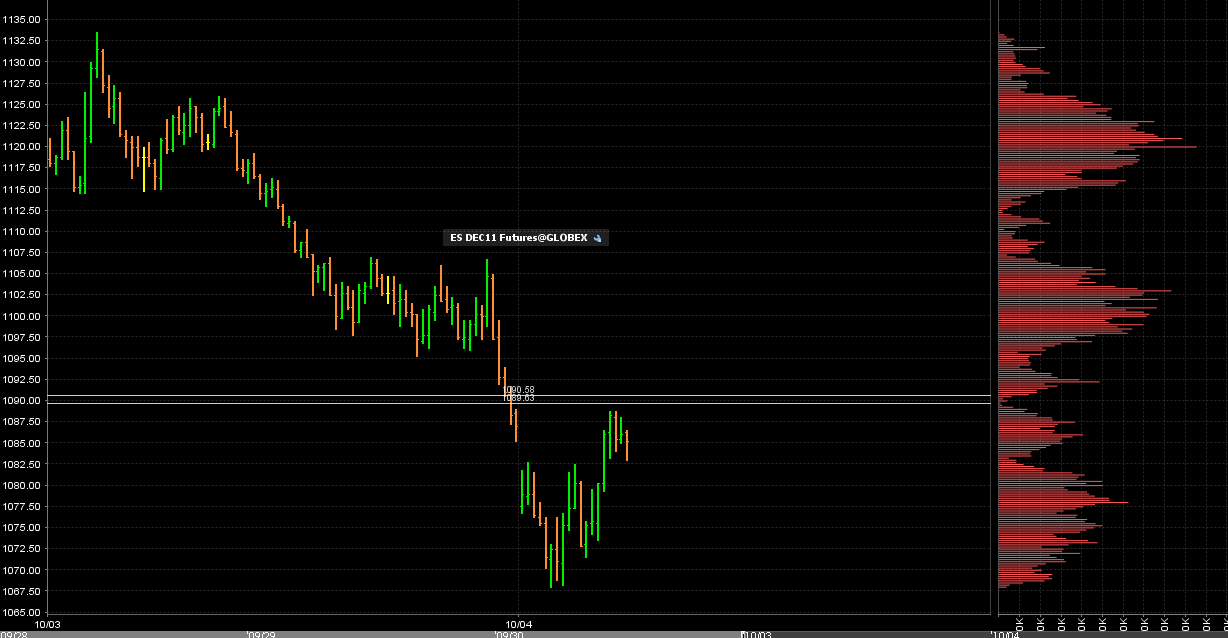
This chart below includes overnight data but only because my IB charts display the histograms better once the day is complete. So I am posting it this way only to present a better visual and no other reason. I do not think you need to incorporate the overnight volume because it is too low.
Today left us with two very distinct bell curves. A double distribution day separated by low volume in the middle. Viewers looking to get better should focus on the volume histogram and draw your high and low volume areas based on that without looking at the price bars.
Hopefully we will get an upmove overnight so we have something to work with in the RTH session tomorrow morning. We will formulate some trade ideas once we see which side of the bell curves price will be entering from in the morning.
It is my experience that highs and lows will form more often based off the low volume areas from previous days and not the high volume areas from previous days. This is opposite from what that Enthios site teaches and the natural true range method but as usual I encourage everyone to do their own research.
This chart below includes overnight data but only because my IB charts display the histograms better once the day is complete. So I am posting it this way only to present a better visual and no other reason. I do not think you need to incorporate the overnight volume because it is too low.
Click image for original size
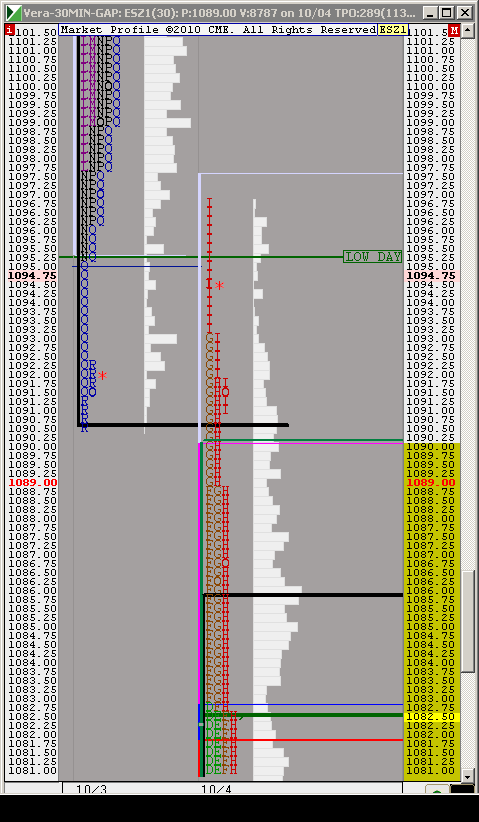
flat on all at 89.50..not holding anything.....important to see why that became a doable trade for me
we had that back and forth price action in between the 88.75 and the 82 area..it created the bell curve...
watching this 88.75 for fill in
we also had the attempt to break out of the 90 minute highs...but here is how my area looked...note the low Volume and the bell curve below it that formed in todays day session.....Now Sean and others had that area from Yesterdays day session......so people saw it for different rreasons..
Click image for original size
Kool. you nailed! 1068.00 right on the money! That was cool dude! Nice to see you posting.
Originally posted by koolblue
Click image for original size
Click image for original size

This is great stuff! I really like your word "confluence" Bruce. For my style of trading what I try to do is align my support and resistance method up with MP philosophies. It meshes extremely well. Understanding the bell curve and low volume, etc. has really added a whole new level to my approach, understanding, and results. So thanks Bruce and others who take the time to post their expertise and opinions on this forum.
Sean
Sean
No problem Sean....we are all in this together....I thought that last short was a bit agressive because that 83 area was tested and it originally held back the selling and then we went on to make new highs...so I thought the buyers may try to push a bit higher if I was wrong.....hence lighter contracts for me and no runners were held...
The bell curve is a big bonus and understanding this tendancy the market has to trade around low volume is essential IMHO..
The bell curve is a big bonus and understanding this tendancy the market has to trade around low volume is essential IMHO..
back to that area from yesterday 97.00
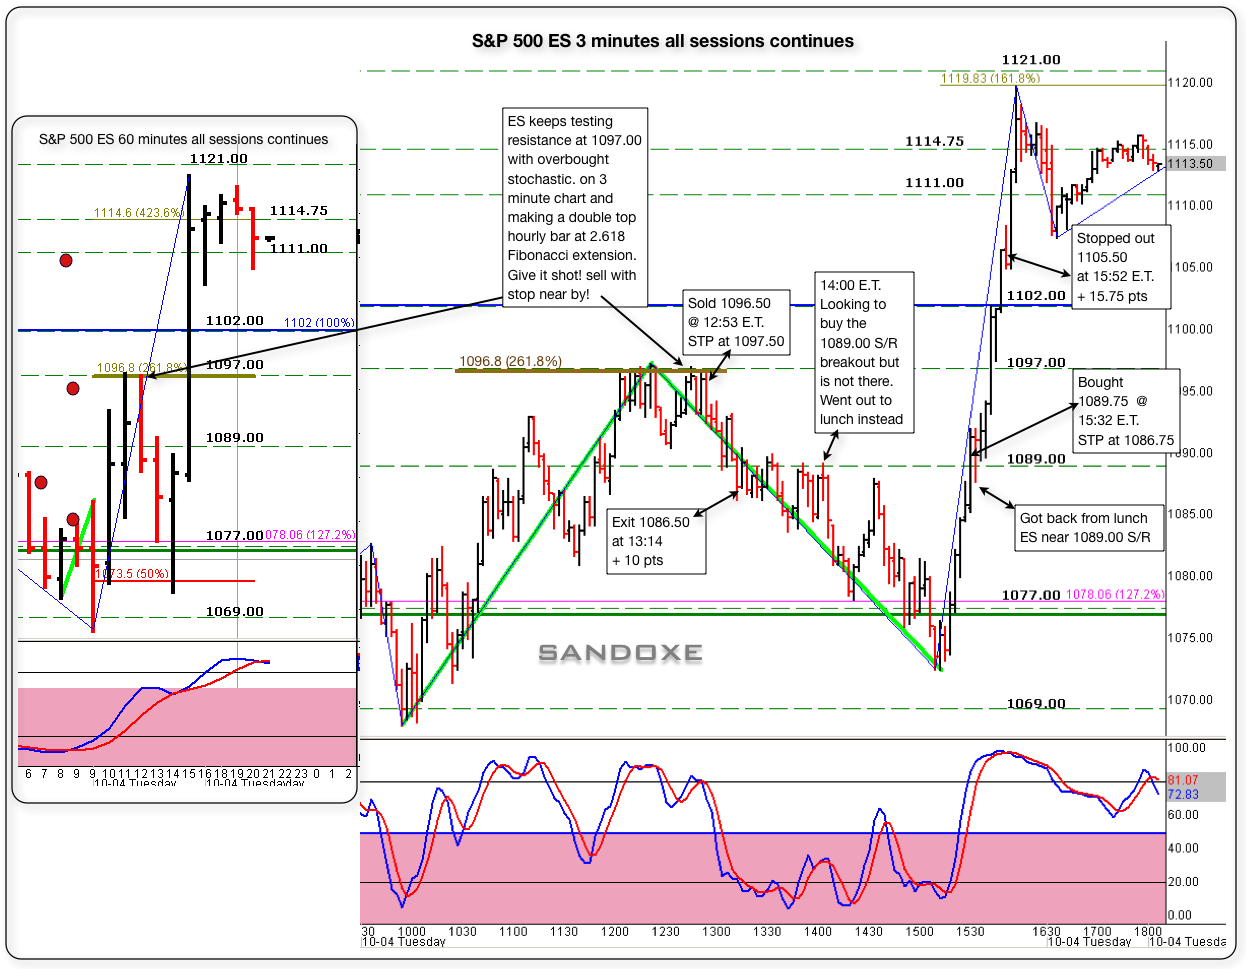
I like to see an hourly bar double top to go short here at 1097.00. The objective will be near 1083. or so (50% ret). Have to be careful if shorting bc the long projection is to 1111.00/1114.00 or so.
ES now trading 1093.50 @ 12:27
ES now trading 1093.50 @ 12:27
Here's a 3 minute self explanatory chart for my posts here at the forum.
Lisa, I don't know what you are referring to when asking about second level. But, we can talk about numbers and S/Rs and that's what I was looking at 12:53 as seeing in the chart below.
I hope this helps in some way. Seeing and playing S/Rs in conjunction with your system.
Lisa, I don't know what you are referring to when asking about second level. But, we can talk about numbers and S/Rs and that's what I was looking at 12:53 as seeing in the chart below.
I hope this helps in some way. Seeing and playing S/Rs in conjunction with your system.
Originally posted by sandoxe
Got back from lunch and ES was moving with good momo and true my 1089.00 and here we are, just hit the objective at 1102.00
ES now trading 1105.75 @ 15:48Originally posted by sandoxe
ES keeps testing 1089 but fail to move above it with some momo. Will wait.
ES now trading 1087.50 @ 13:56 E.T
Time for some delicious lunch hmmmmm.
Originally posted by sandoxe
I'm looking to buy from 1089.00 S/R. will let it test a bit and see if sets up for me.
Objective 1097/ 1102.
ES now trading 1088.75 @ 13:34
In due time will show us the way.
Click image for original size
Emini Day Trading /
Daily Notes /
Forecast /
Economic Events /
Search /
Terms and Conditions /
Disclaimer /
Books /
Online Books /
Site Map /
Contact /
Privacy Policy /
Links /
About /
Day Trading Forum /
Investment Calculators /
Pivot Point Calculator /
Market Profile Generator /
Fibonacci Calculator /
Mailing List /
Advertise Here /
Articles /
Financial Terms /
Brokers /
Software /
Holidays /
Stock Split Calendar /
Mortgage Calculator /
Donate
Copyright © 2004-2023, MyPivots. All rights reserved.
Copyright © 2004-2023, MyPivots. All rights reserved.