ES Wednesday 10-5-11
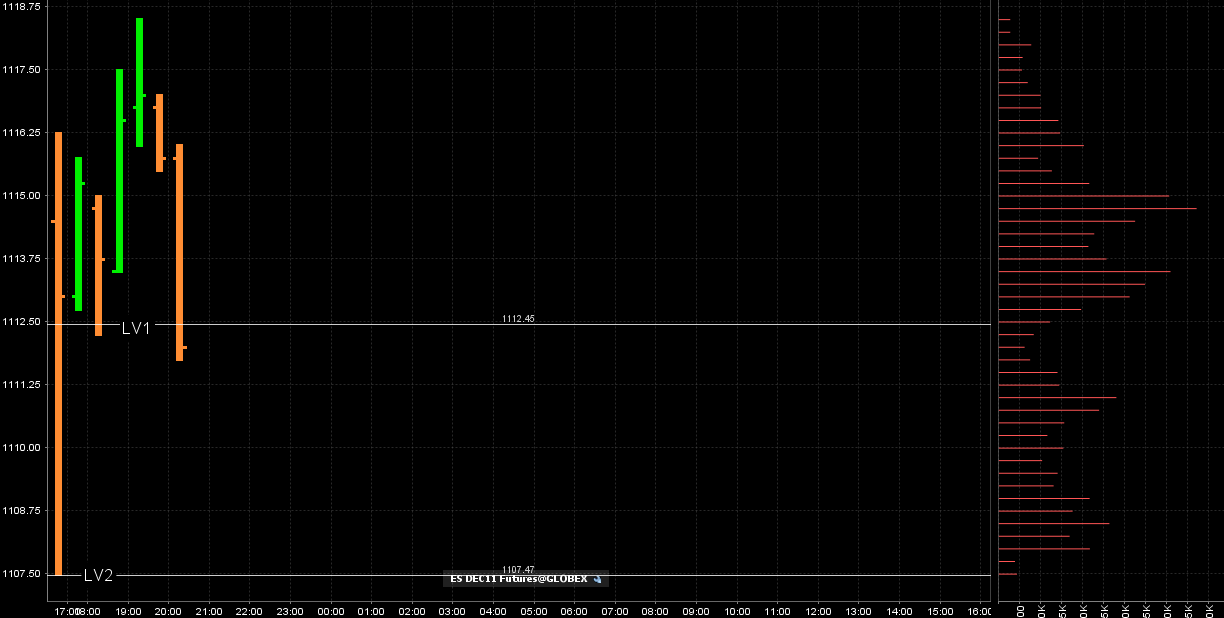
Very interesting finish today which hopefuly will helps us expand our knowledge of the bell curves. At the end of today we blew right through the high volume node of 1102.75 and then preceeded to blow through the low volume nodes ( LV1 and LV2 zones from yesterdays chart) that comprised the 1107.5- 1112.50 area. The market then stoped at our high volume area of 1120.
The rules as I have stated them say that we will come back to test LOW volume and that is why I choose to be more agressive in the low volume zones. They donot state that we will retest high volume and that is why I donot trade at those areas for retests once broken. Like all trading methods this has it's losses and trading at the end of the day is more prone to trend then in the morning. So if you were trading this afternoon it would have been most challenging but here is the interesting part. As soon as the Overnight opened the market dropped like a rock to come back down to test all the way down to our 1107.50 and retest the entire zone...like it should.
here is how the overnight looks as I type...the point of all this babble is that we can count on Low volume being tested but not so much the high volume nodes once broken.
Click image for original size
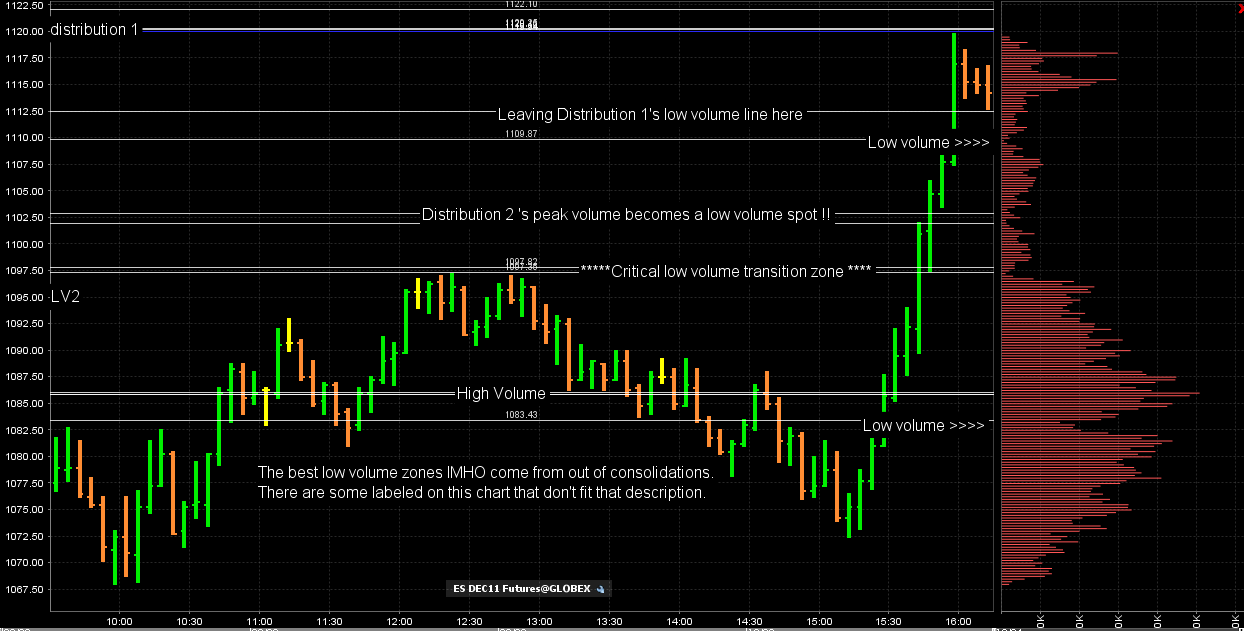
Some big questions to ask our selves now. The first one would be this: What is going to happen with the bell curve I labelled as distribution one on yesterdays chart. This had a upper low volume zone of 1126 - 1128, a peak volume price of 1120.25 and a low volume zone of 1112.50. Will price be able to hold up inside the lower edge of 1112.50 in the day session tomorrow to keep going higher or will it fail and price fall back down ? Will distribution one be resistance still ?
Falling back down has that huge transition point at 1197.50..this is thee point where high volume ( the consolidation) became low volume - the breakout. A big area. I have also included the low volume at 1112.50 because that was high volume from yesterday and is a low volume spot from today. The Overnight will help us with refining the areas.
Falling back down has that huge transition point at 1197.50..this is thee point where high volume ( the consolidation) became low volume - the breakout. A big area. I have also included the low volume at 1112.50 because that was high volume from yesterday and is a low volume spot from today. The Overnight will help us with refining the areas.
Click image for original size
None of my levels line up in a clean way so tomorrow I'm watching 1120, 1197 & 1072.. Short 1120, long above 1197&short below, long 1072&etc..
Between 1120&1197, I will be watching the LV areas compliments from Bruce: 1110/1102.50 in between if trades set up there or target areas.. 1197&1120 are both LV as well..
I will basically look for local highs/lows as additional confirmations to lean on and use the 20ema to help me with my directional bias..
If price falls below 1072, I will assume 1068 will be taken out and will short 1072 on retest..
Happy trading!!
good morning
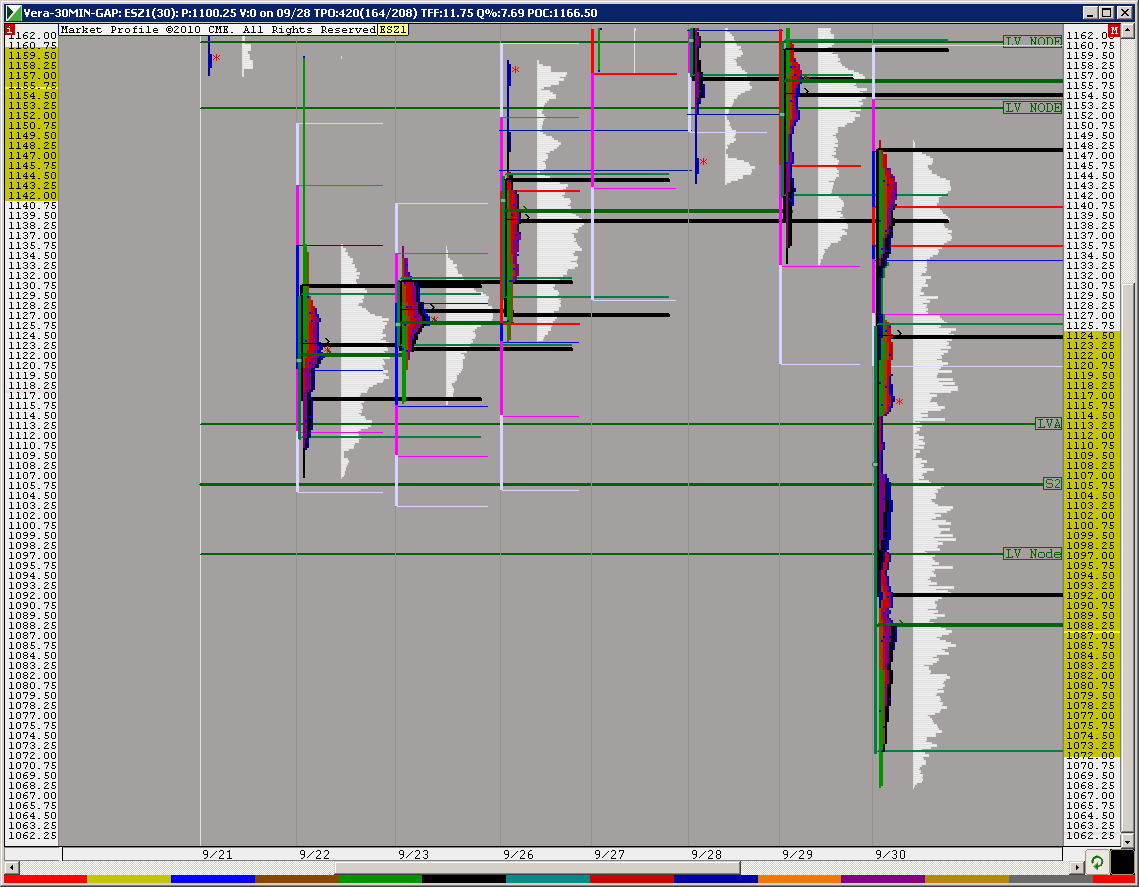
Bruce or Lisa can you put up a chart showing the last 3 days of VOL conbine together
as you were talking about bell curve I would like to see what has filled in ,Im looking at my TPO
27.00 to 30.00 area looks like it has not filled in on over lap 6.00 to 14.00 last night they beat on that area pritty good
question for people better versed than I in the KoolBlue methodology of price projection:
How do you treat the ONE-WAY move yesterday afternoon?
Are you able to make any projection? the 5min chart had no appreciable retrace to define an initial move, until after 4pm, did it?
-Do you treat the whole run-up as an inital move? or do you move to a different (longer or shorter) time bar?
If you treat that run-up as an initial move, I'm getting a 2.618 extension of something near 1197 a 1.618 of 1149 area.
Bruce thanks for all you explanations for using the V at Price.
I have a question: do you have any rules about using the overnight V at price?
right now, 8:39am ET, I see HVN at 1112.50. Mean anything for overnight?
that does't mean anything specific Paul but it does confirm that line from distribution one that I left on the chart posted today...the overnight more or less just confirms the areas....
a few themes I am working from today:
1) If we open above 1112.50 I think there are good odds that the day session will need to come back down to test that low volume in the 1107.50 - 1112.50 zone....they didn't get time to do that test as the market closed too soon yesterday. The overnight test is "Nice" but I think the bigger traders will need to make that test..
2) The overnight high couldnot get out of the Distribution one highs...my plan will be to sell above that high in the 1126 - 1128 area as per distribution one. I will also sell on any signal near the 1120 highs keeping in mind that 1112.50 idea at all times!!!critical to me today
3) Above that I prefer sells as close to 1133 as possible as that begins the big BELL curve of Fridays trade..see that chart
4) Holding below the 1107.50 will be a bad thing for bulls as that means we are not only rejecting distribution One but we are back into distribution two from Mondays trade but be careful back in there. We donot blow through distributions twice in a row easily. Yesterday they blew through distribution Two very quickly...they will not do that on the downside if they try to sell off..they will chop in there..warning in there in general
5) The best trade idea is sells to get back into the 1112.50 and lower..
we also have a low volume zone at 1112.50 as per yesterdays chart as an additional magnet.....openings inside bulling spikes usually see back and forth rotations and don't usually trend well inside there...be nimble or lose!!
Della, as per your request, last profile is a combo of the last three days.
Bruce, did you mentioned that you do not use combination profiles?
Bruce, did you mentioned that you do not use combination profiles?
Click image for original size
my plan for buys would really need to be under the O/N low near 1107.50 as I think we will get a pop up from down there
that is generaly True Lisa....but when we are inside to previous days it can help...slightly!!
Peak O/N volume is our number at 1112.50!! I have a small short at 1119.50...but feel the better add will come above 1120...LOw volume in O/N session and the key volume of Distibution one..
Peak O/N volume is our number at 1112.50!! I have a small short at 1119.50...but feel the better add will come above 1120...LOw volume in O/N session and the key volume of Distibution one..
lisa thank you boy that shows everything for today at least for my 91.05 mins of trading
Originally posted by Lisa P]Della, as per your request, last profile is a combo of the last three days.
Bruce, did you mentioned that you do not use combination profiles?
Click image for original size
Thanks Sandoxe, I missed your reply & just found it when researching the posts, what formula would I use to calculate these previous 3 days S/R levels?
regards Brent.T
regards Brent.T
Emini Day Trading /
Daily Notes /
Forecast /
Economic Events /
Search /
Terms and Conditions /
Disclaimer /
Books /
Online Books /
Site Map /
Contact /
Privacy Policy /
Links /
About /
Day Trading Forum /
Investment Calculators /
Pivot Point Calculator /
Market Profile Generator /
Fibonacci Calculator /
Mailing List /
Advertise Here /
Articles /
Financial Terms /
Brokers /
Software /
Holidays /
Stock Split Calendar /
Mortgage Calculator /
Donate
Copyright © 2004-2023, MyPivots. All rights reserved.
Copyright © 2004-2023, MyPivots. All rights reserved.