ES Thursday 10-6-11
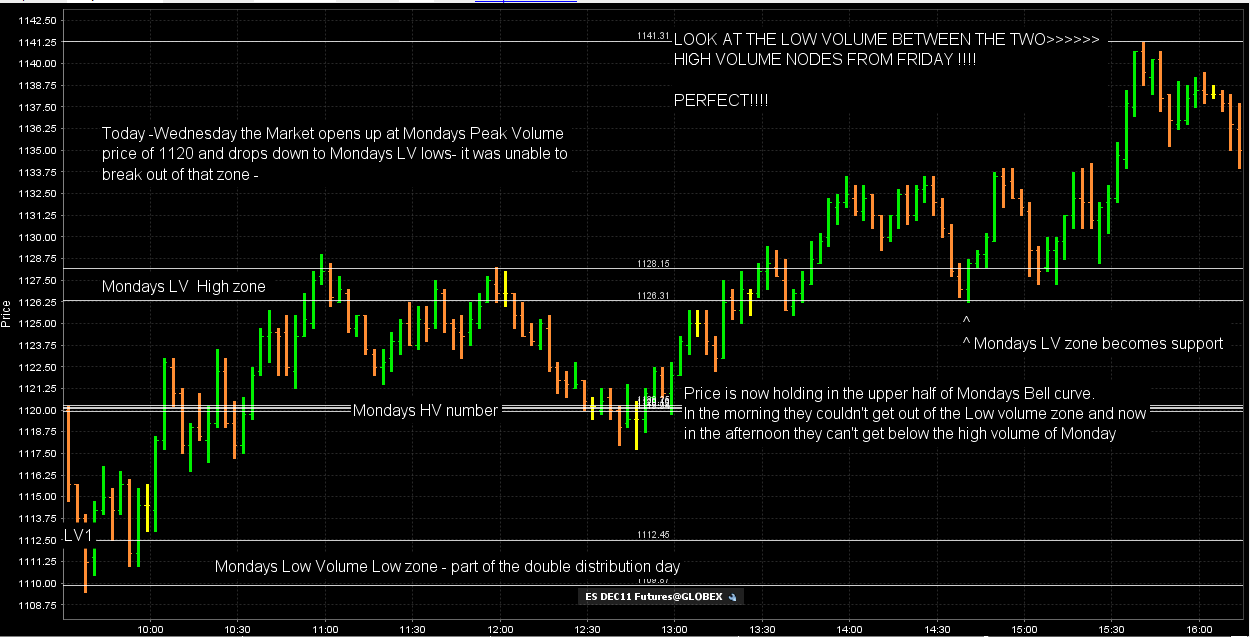
Here is a recap chart from Wednesday. I'm going to get the date right tonight. Very instructive day and was hoping we'd have some good examples this week. You may want to reference Mondays and Fridays chart to understand this a bit more as those "bell curves" interacted nicely with todays trade.
Click image for original size
sandoxe, what high and low are you using to arrive at 1162 fib extension? thanks
Originally posted by sandoxe
Capitalista and Lisa P. have the same numbers 1156.00 and they where derived differently. I also have 1156 as S/R, so we have a cluster in this area. It's most likely we will have some small zigzags there.
Capitalista, I also have 1162 as fib. extensions. and 1163.00 as S/R so there's a target cluster there.
Right now the support to play to the outside is at 1148.00.
Below 1148 next support is at 1143.00.
ES now trading 1152.25 @ 12:28
Will see, in due time the market will show us the way.
NickP. Using the Fibonacci 3 point extension tool in you 3 minute chart.
1) 09:15 1131.25 low
2) 09:42 1140.00 high
3) 09:54 1129.00 low
The extension you will see is 2.618% at 1162.25
If you look in the O/N there's also a 200% in the 1162 area.
and some more 2.618s at 1163 or so
P.s. You have some Qs about the fibs. in the chart posted last night. I will get back to you and post late afternoon.
Originally posted by NickP
sandoxe, what high and low are you using to arrive at 1162 fib extension? thanks
Originally posted by sandoxe
Capitalista and Lisa P. have the same numbers 1156.00 and they where derived differently. I also have 1156 as S/R, so we have a cluster in this area. It's most likely we will have some small zigzags there.
Capitalista, I also have 1162 as fib. extensions. and 1163.00 as S/R so there's a target cluster there.
Right now the support to play to the outside is at 1148.00.
Below 1148 next support is at 1143.00.
ES now trading 1152.25 @ 12:28
Will see, in due time the market will show us the way.
thanks; i generally look at 2 pt fib extensions that is why it was not clear to me how you had arrived at 1162 and at the other levels shown on your chart yesterday evening
Sorry I used the 3 point but used it as a two pointer
1) 09:15 1131.25 low
2) 09:42 1140.00 high
the 3 point I click it back into the high. so it's only a two point reference. Low and high.
I know people don't used it that way but it's a high and a low made by the price. Any high or any low is a point of reference to me.
Same is with the chart last night. But I will get back to you and post that, late afternoon.
[quote]Originally posted by sandoxe
NickP. Using the Fibonacci 3 point extension tool in you 3 minute chart.
1) 09:15 1131.25 low
2) 09:42 1140.00 high
3) 09:54 1129.00 low
The extension you will see is 2.618% at 1162.25
If you look in the O/N there's also a 200% in the 1162 area.
and some more 2.618s at 1163 or so
P.s. You have some Qs about the fibs. in the chart posted last night. I will get back to you and post late afternoon.
[quote]Originally posted by NickP
sandoxe, what high and low are you using to arrive at 1162 fib extension? thanks
1) 09:15 1131.25 low
2) 09:42 1140.00 high
the 3 point I click it back into the high. so it's only a two point reference. Low and high.
I know people don't used it that way but it's a high and a low made by the price. Any high or any low is a point of reference to me.
Same is with the chart last night. But I will get back to you and post that, late afternoon.
[quote]Originally posted by sandoxe
NickP. Using the Fibonacci 3 point extension tool in you 3 minute chart.
1) 09:15 1131.25 low
2) 09:42 1140.00 high
3) 09:54 1129.00 low
The extension you will see is 2.618% at 1162.25
If you look in the O/N there's also a 200% in the 1162 area.
and some more 2.618s at 1163 or so
P.s. You have some Qs about the fibs. in the chart posted last night. I will get back to you and post late afternoon.
[quote]Originally posted by NickP
sandoxe, what high and low are you using to arrive at 1162 fib extension? thanks
NickP. When you have some time. Try low to low or high to high. You will be surprise of what you see as confluence.
Originally posted by NickP
sandoxe, what high and low are you using to arrive at 1162 fib extension? thanks
i don't think i follow you when you say low to low or high to high, so if you can give me an example it'd be great; no rush of course
i generally follow kools' rules in that if a low or high is taken out then the projections off that low or high are no longer valid; that is why the projections off the 31.25 low would have been invalidated when we got down to 29
i generally follow kools' rules in that if a low or high is taken out then the projections off that low or high are no longer valid; that is why the projections off the 31.25 low would have been invalidated when we got down to 29
Today's profile is beginning to take on the p shape.
Lorn, my concern is that the peak volume price has now flipped up so now peak volume is inside of That key range...it is above the low...so price is being accepted in there....
what's your afternoon crystal ball say ??
Originally posted by NickP
thanks !
My pleasure NickP.
Emini Day Trading /
Daily Notes /
Forecast /
Economic Events /
Search /
Terms and Conditions /
Disclaimer /
Books /
Online Books /
Site Map /
Contact /
Privacy Policy /
Links /
About /
Day Trading Forum /
Investment Calculators /
Pivot Point Calculator /
Market Profile Generator /
Fibonacci Calculator /
Mailing List /
Advertise Here /
Articles /
Financial Terms /
Brokers /
Software /
Holidays /
Stock Split Calendar /
Mortgage Calculator /
Donate
Copyright © 2004-2023, MyPivots. All rights reserved.
Copyright © 2004-2023, MyPivots. All rights reserved.