ES Monday 10-10-11
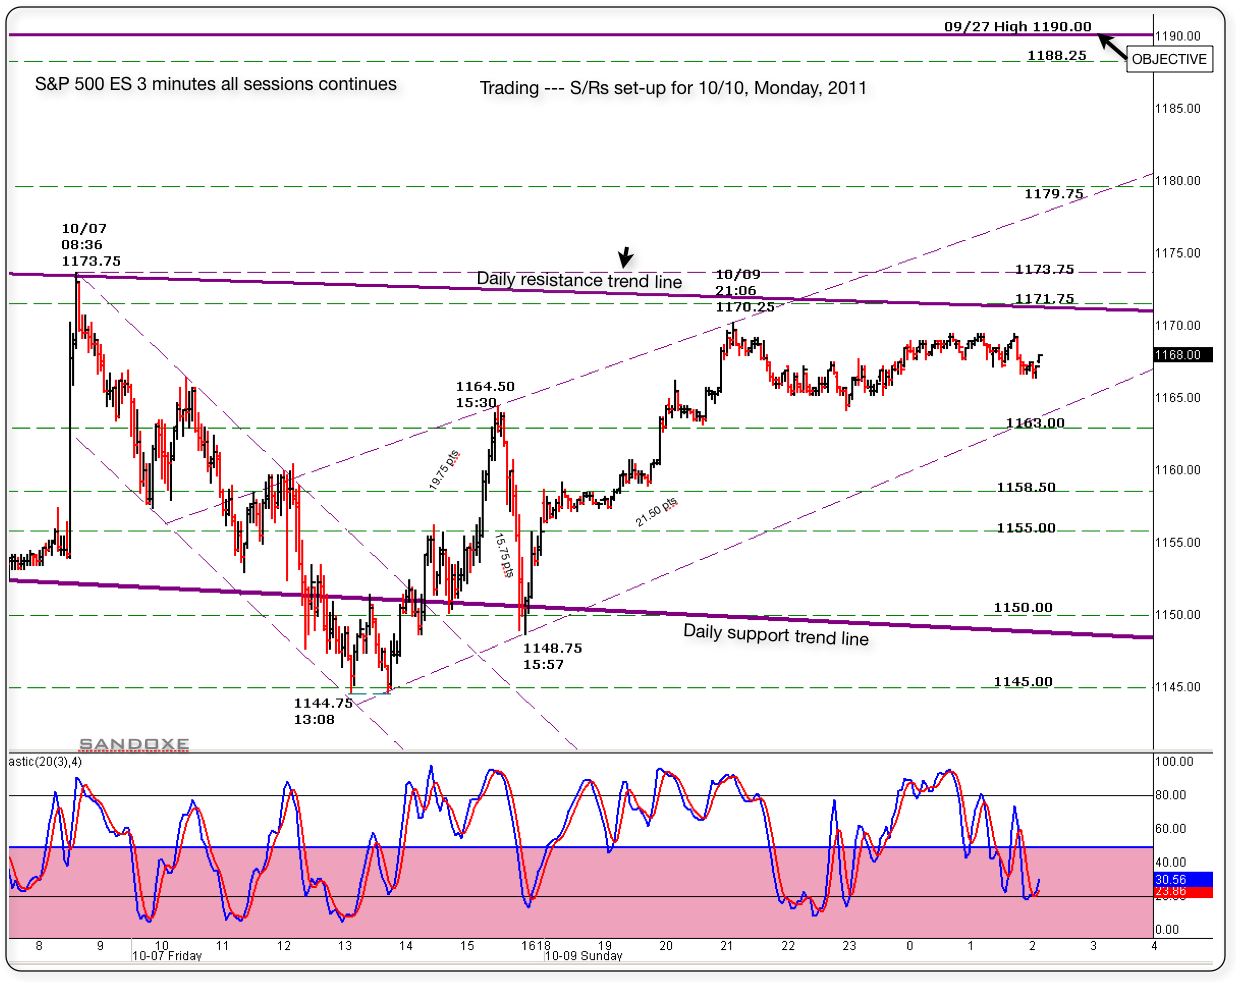
Here is the same Friday's 3 minute chart following up for Monday's S/Rs play.
Reviewing the daily chart I found one more resistance line that will be crossing around 1170/1168 on Monday, as seeing in the chart.
Moving above that trend line and testing as support will target the 1190.00 Objective.
I like to borrow some posts from Friday bc the same S/Rs are applicable for Tomorrow's session. (1163/1157/1145/43 and 1129)
____________________________________
sandoxe | 7-Oct-2011 at 9:25 AM
It's important for the ES to close over 1163.00 in a daily basis. if so, next objective is 1190.00. 1190.00 is 09/27 high.
1163 was the S/R objective for yesterday. Now becomes the S/R base to play the out side. Below 1163.00 is 1157.00 also important
to keep in mind.
____________________________________
sandoxe | 7-Oct-2011 at 12:35 PM
Wow. This market is gonna have to work very hard to get out of the negative fractal created today. Lots of zig-zags of 20 or more points to get out of it.
The other way, will be to go down to 1143.00 or 1129.00, gather some momo and back up to break 1170.00, few days in this area.
If 1129 does not hold? --Back to test 1068.00....
JMO.-.-..
____________________________________
The above post mentioned that the market could be making 20 points (+-) swings moving to break 1170.00. -( Actually Friday's high 1173.75).
Notice that in the chart, the ES has made some good moves, close to 20 pts since that post. I hope it maintains that volatility, I love it!
As always, the market has the last word and in due time will show us the way.
I see for you the same I se for my self: Having the best of luck and fun, awesome profitable trading day!
Click image for original size
areas I am looking to buy against today if we gap higher open in RTH will be:
1164.75
1161
1156 *** the best low volume zone from friday...others above here are not as shallow
1147.50
areas I am looking to sell against:
1172.50 - 1175
then I will wait to the extremes of the next low volume area up at
1179 - 1180.50....the closer to this the better
and then if given the chance will be the 1187.50
Today is columbus day in the U.S. I don't expect volume to be great even though the market is open. It seems that it will be a higher probability to mean regress back into Fridays RTH range in the day session today with a higher open.
As I type the overnight session is making a big bell curve itself with 72.25 at the highs and 62.75 at the lows..so in general we have a lot of numbers lining up in the 61 - 64 zone. That will be a good buy zone. Now that the overnight high is up against our 72 area then that is telling us that we have a good sell zone also. Once again the overnight session numbers line up with the day session key areas.
Where people fail, and I have failed often is they donot patiently wait for their numbers to hit. They become afraid they will miss the move. We don't trend much in the A.M. and with no reports and a holiday then it is even more unlikely to trend. Just pick your spots and take the trades. Don't be compulisive.
Good luck today...
Trades initiated in between those zones is higher risk in my opinion.

any shorts from up above the 72.50 would be foolish not to take something off in front of the 69 peak volume..68.75 was also a number we referred to on Friday!!
I'm looking short into 73.50 right now !!
I'm looking short into 73.50 right now !!
Any foot print up here ??
trying again from 76 even...risk being that the 68.75 - 69 is now going to try and become support...targeting 73.50 and then 71.25..both low volume created today!!
the 80 area is next sell area but not averaging in.
the 80 area is next sell area but not averaging in.
nobody atthe 73.75....yet!!..they are gonna fill that !!
bringing second target up to 71.50
trying a third time up here is more agressive as now we are finding support in the 72.50 - 75 zone too.....prefer to see a push above 79.25 to start looking agin if they can push it....and then target an air pocket inthe 76 area...we'll see
almost 10 am
shorting into 78.75...slight jump and small...better shorts are just above here...gotta be careful in case they do the big volume flush to run stops up here
Ditto here. I've seriously tried to understand and distill down what/why/how with your postings over time ... when you were active in the past and also currently. I'm at a loss - even now. It's primarily just numbers posted without any conveyed, understandable rationale for actual learning or trading as a day (or days) unfold.
More significantly, it's so much "if then," where the IF and THEN are not described in a way that fills the space between the prognostications ... and when price does (and also DOESN'T) reach one of the multiple levels posted. In a word, it's "confusing."
More significantly, it's so much "if then," where the IF and THEN are not described in a way that fills the space between the prognostications ... and when price does (and also DOESN'T) reach one of the multiple levels posted. In a word, it's "confusing."
Emini Day Trading /
Daily Notes /
Forecast /
Economic Events /
Search /
Terms and Conditions /
Disclaimer /
Books /
Online Books /
Site Map /
Contact /
Privacy Policy /
Links /
About /
Day Trading Forum /
Investment Calculators /
Pivot Point Calculator /
Market Profile Generator /
Fibonacci Calculator /
Mailing List /
Advertise Here /
Articles /
Financial Terms /
Brokers /
Software /
Holidays /
Stock Split Calendar /
Mortgage Calculator /
Donate
Copyright © 2004-2023, MyPivots. All rights reserved.
Copyright © 2004-2023, MyPivots. All rights reserved.