ES Tuesday 10-11-11
The following resistance points are created from trade on 9-20 and 9-21.
1193.75 Low volume
1200 key number
1205 - 1206 Low volume and the best low volume number as we move up..assuming we move up
support points are created from Mondays trade at :
1186 - 1188 low volume
1182.50 peak volume - I will not use this area for entry
1180 - 1181 low volume
1175.75 - 1176.50 low volume
71.50 - breakout point from overnight trade
as usual the low volume is where the better trades are at.
Honorable mention to the 1214 - 1215 area in case we really get a move up
watching volume trying to build out at 87.75...a little more time and the POC will flip lower...bad for long players
just snapped this off my back deck...for those who don't get to see Vermont foliage too often...it's not optimum this year but we take what we get!!
Click image for original size

gheesh...not sure why that photo is so friggin big!!
Love the north it will be changing colors soon another month
not that many lows to day
Hey Bruce, may've mentioned I'm flying into Vermont for a vacation early next month with my sweetie. It's her "homeland" ... tons of family up there. Great pic ya got. Evidently, most of the leaves will be gone by then according to her. So I'm gonna miss out - bleh! (btw, I think I see Big Foot behind the 8th tree from the left, three deep)
only one trade for me as ES pulled back to OR high after A up. Trading mainly CL and waiting for ES to come to my area of interest has been helpful.
http://www.screencast.com/t/yf6a5LMvT23
http://www.screencast.com/t/yf6a5LMvT23
Originally posted by destiny
only one trade for me as ES pulled back to OR high after A up. Trading mainly CL and waiting for ES to come to my area of interest has been helpful.
http://www.screencast.com/t/yf6a5LMvT23
Correction: Long 1188 stop loss 1185.
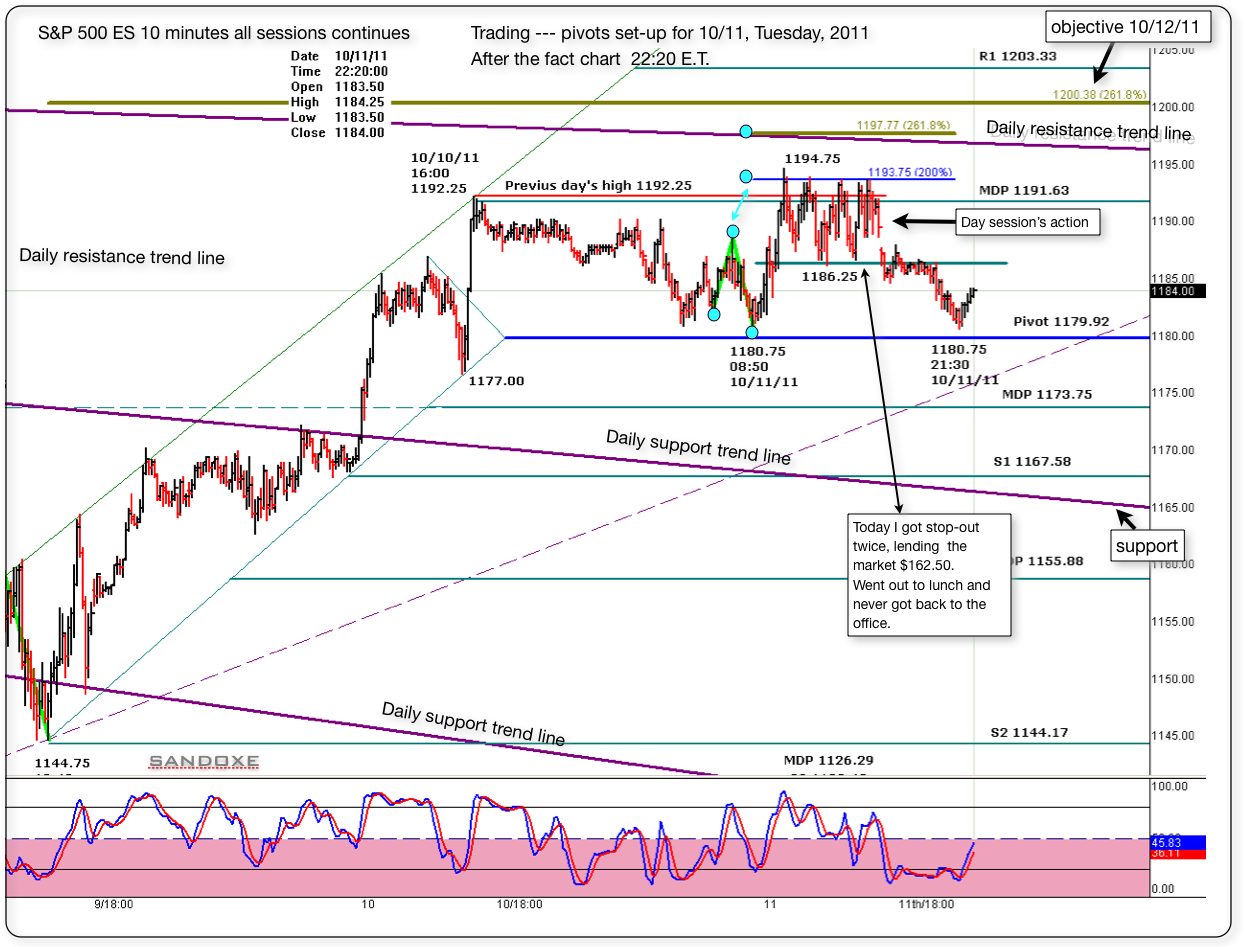
Below you will see today's trading session "after the fact ES 10 minutes chart" and some notes. The chart is self explanatory. Below that chart, you will see the same 10 minutes "before the fact chart" posted before the trading session.
Good visual learning from those two charts.
Good visual learning from those two charts.
Click image for original size
Originally posted by sandoxe
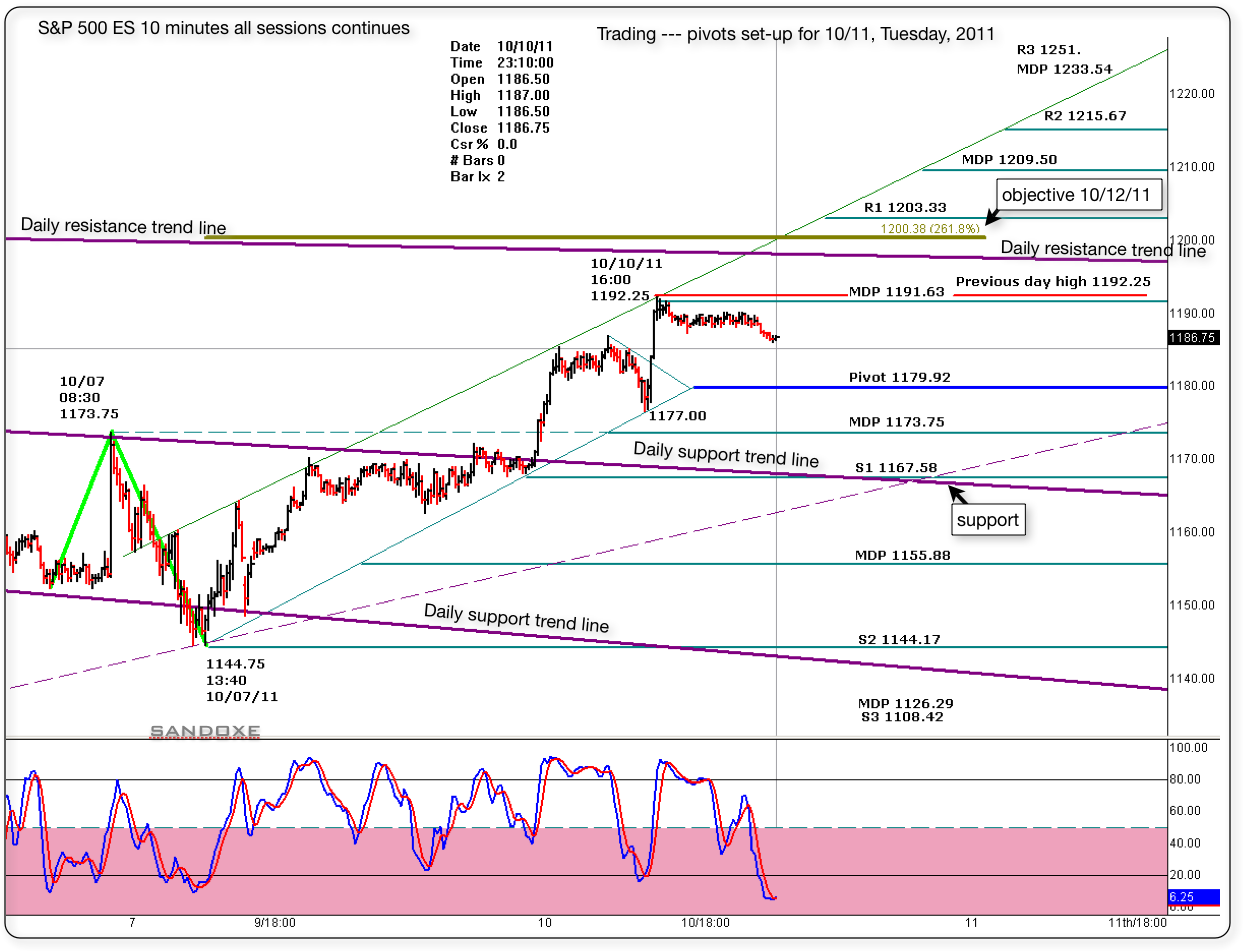
Here's an all sessions 10 minute chart with the pivots for tomorrow. As you can see, some of the levels are congruent with previous highs and lows.
The 1167.00 S1 level is a nice support bc the daily trend line is crossing that area tomorrow morning. So "if" (don't you hate that word?" ) the market moves down, it's a good place to consider taking profits and maybe look for a buying set-up. Below that, the next level will be 1144.25. Way down there, but it's good to know that's there.
For the outside. Notice that we have an MDP at 1191.50. And today's high is near by at 1192.25. So, moving above 1192.25 will target 1200.00 (I have 1200 objective for 10/12/11 but it could due it tomorrow) and possibly the 09/20 high at 1214.50. But there's a daily resistance trend line crossing tomorrow at about 1195.00. Will be great if it jumps it overnight and never looks back. That will be bullish!!!!
Will see. As always, the market has the last word and in due time will show me the way.
I see for you the same I see for my self: Having the best of luck and fun, awesome profitable trading day!
Click image for original size
new video Steidlmayer Volume Strips: A New Method to Analyze the Markets http://www.cmegroup.com/education/steidlmayer-volume-strips-video.html
Emini Day Trading /
Daily Notes /
Forecast /
Economic Events /
Search /
Terms and Conditions /
Disclaimer /
Books /
Online Books /
Site Map /
Contact /
Privacy Policy /
Links /
About /
Day Trading Forum /
Investment Calculators /
Pivot Point Calculator /
Market Profile Generator /
Fibonacci Calculator /
Mailing List /
Advertise Here /
Articles /
Financial Terms /
Brokers /
Software /
Holidays /
Stock Split Calendar /
Mortgage Calculator /
Donate
Copyright © 2004-2023, MyPivots. All rights reserved.
Copyright © 2004-2023, MyPivots. All rights reserved.