ES Thursday 10-13-11
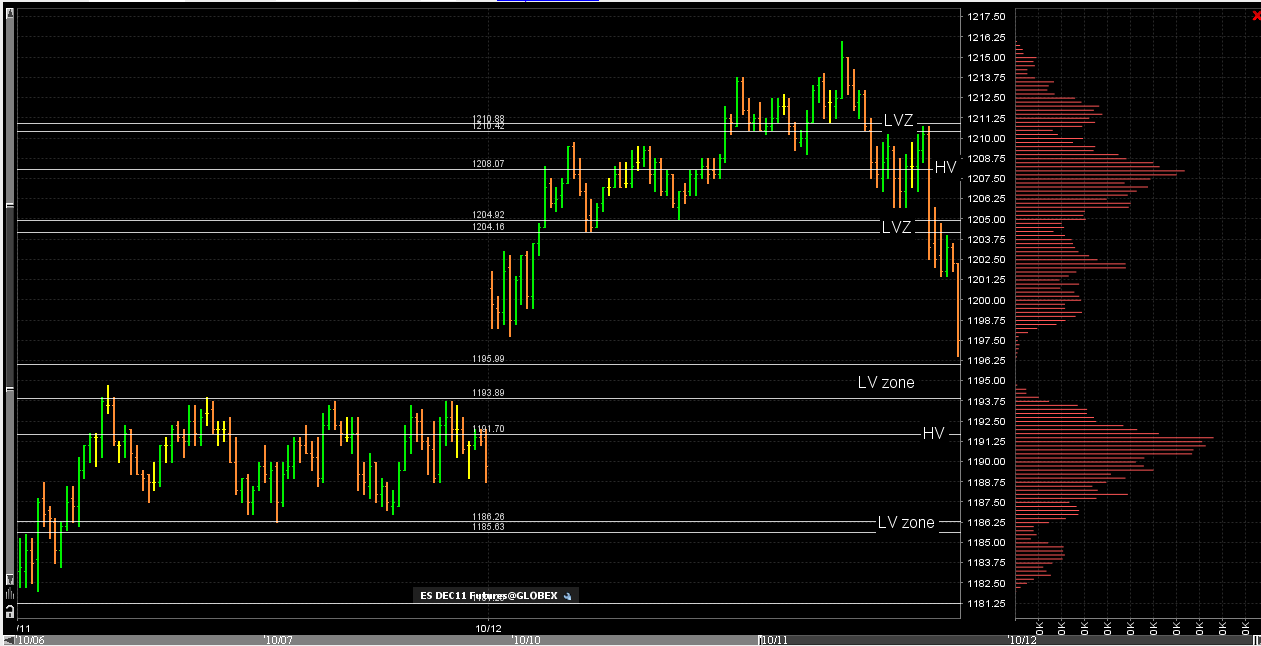
I know many are getting new charts and becoming familiar with volume profiles. Here is the last two days for reference with the appropriate high and low volume marked off. This way those who are new can compare their charts to this one. Lots of good bell curves to work with once the 8:30 reports come out
Click image for original size
Bruce, I have a question. Please let me know when you are done for the day.
What did you guys do? The market was doing well. now my stop got hit at B.E. -- Had and awesome day yesterday, and today I suck!
The market still owes me $ 150.00 bucks from this morning. hmmmm I need to see my self doing better, much better.........
The market still owes me $ 150.00 bucks from this morning. hmmmm I need to see my self doing better, much better.........
Originally posted by sandoxe
I gave it an other shot above the support trend line same price 1195.75 I'm at B.E. and will seat here till it gives me 1216 LOL
Bruce, thank you for all the teachings today. I read all the post today to make sure i wasn't missing anything from your train of though and everything came out pretty clear i must say. The one thing i could not see clearly was that 93.75 level you mentioned as the lower edge of the upper bell curve. I assume this bell curve is from today's price action. If not, sorry for the confusion and thanks again for your contributions
still triing to fill in that 98 area
No Nick the 94 - 96 is from the chart on todays threads page one...sometimes I have numbers in my head and I type fast so I use them interchangeable...so the 93.75 and the 94 are really the same lower edge...one is more precise but it really is the same area.. I'm in hyper mode when I trade and type and can't always go back to fix it and sometimes I just get plain lazy!!
If you look on todays chart my softare put in 1193.89 - 1195.99....this turned into 1194 - 1196 as the software labels it automatically...hence another reason I want everyone to know how to find their own zones...I know you currently work hard and do you own lines so that isn't directed at anyone specifically
If you look on todays chart my softare put in 1193.89 - 1195.99....this turned into 1194 - 1196 as the software labels it automatically...hence another reason I want everyone to know how to find their own zones...I know you currently work hard and do you own lines so that isn't directed at anyone specifically
Fire away Lisa...I have my kids around now but will answer if I can
Originally posted by Lisa P
Bruce, I have a question. Please let me know when you are done for the day.
Della ..see how the 94 - 96 stayed in play? even though we had the 89 and 91 high volume magnets that were generated during todays trade..the zones from yesterday stopped it dead on this last drop
Great learning curve again today, thankyou to all for sharing.
well Lisa..I can't always post as I enter... I hope I can assume by now that nobody really expects me too....although it might be fun sometimes to follow others trades...it's always more important to me that folks understand the reasons for the entry and the targets ..the logic.....so some will have to pardon me if I just can't take the stress of posting and trading...
it's strange but sometimes I actually feel guilty If I don't get the entry posted close to when I actually take it.....that comes form years of coming across people who just don't actually trade and are tryingto sell me stuff...LOL
Forgive me Lisa if I used your post to go on my mini rant!! Not personal to you...
Originally posted by Lisa P
I missed this, posting...lol. I amdefinitely not as good as Bruce at it. Bruce, you are da man. Thanks for sharing with us.
yes i do when you talk about yesrerday you mean 10/11
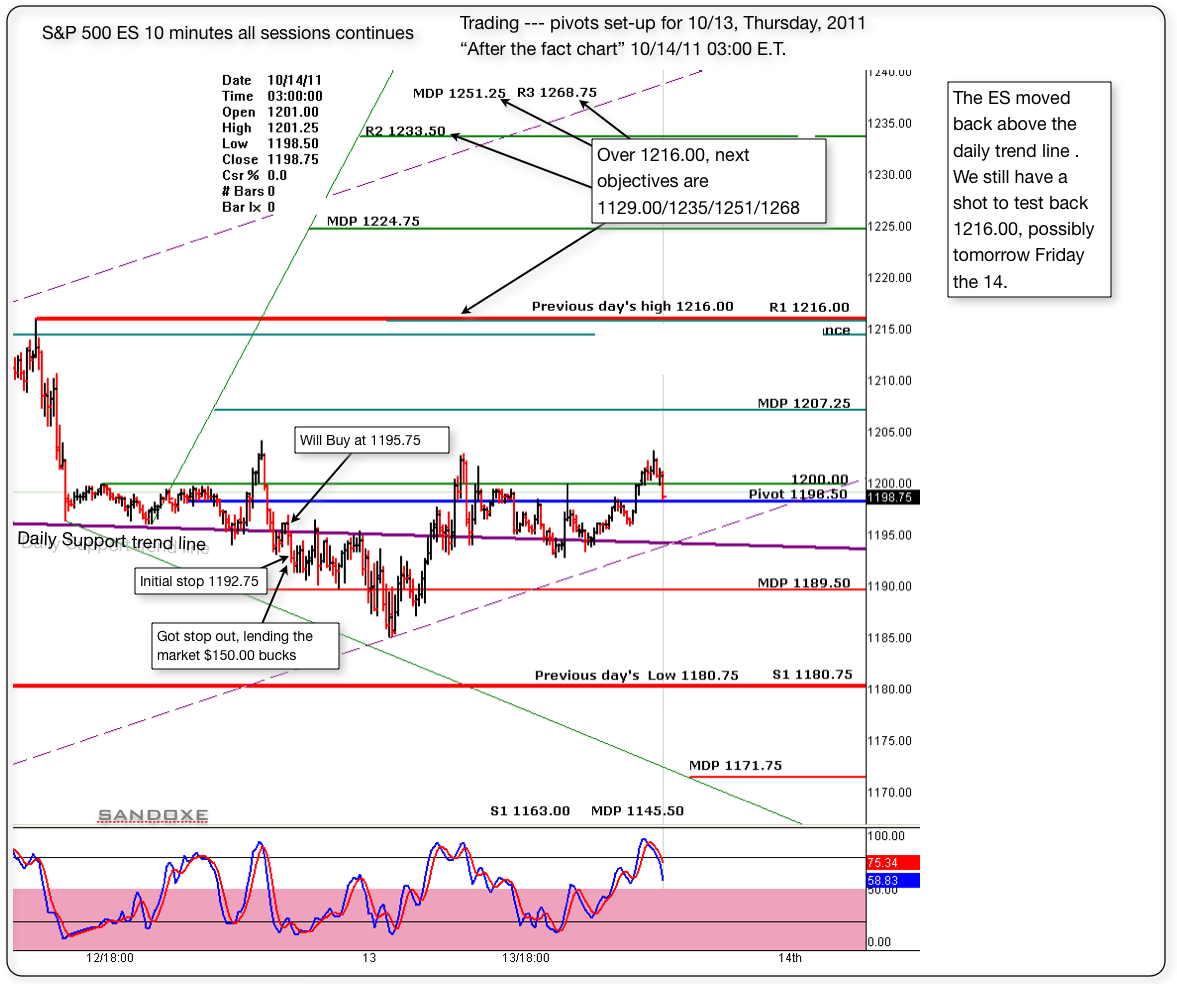
Below is the 10 minutes follow up chart or "after the fact chart" Today was not my day. After the first trade I knew it was best to stay away. Did one more trade and luckily got stop out at B.E. But, I still lend the market $150.00 for the day.
In trading, you will find, that, no matter what system you have, or how good of a trader you are, there will be days when you are not in the "zone" Those are days that it's better to close shop and go play.......
In trading, you will find, that, no matter what system you have, or how good of a trader you are, there will be days when you are not in the "zone" Those are days that it's better to close shop and go play.......
Click image for original size
Originally posted by sandoxe
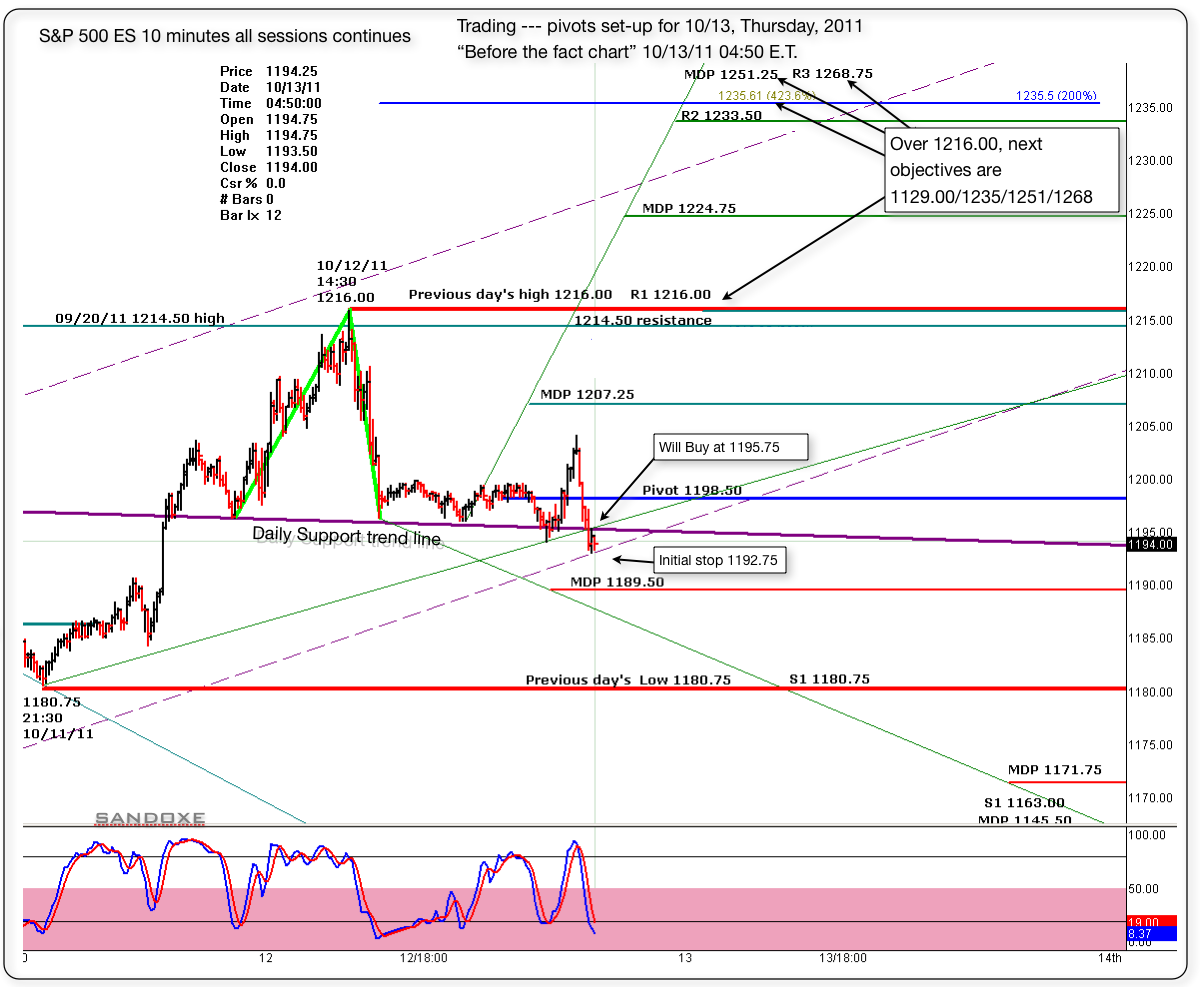
If the bulls still want to give it one more test to 1216, and possibly 1229 with good spike after that I'm Ok with it. Maybe today and tomorrow.
Below is the "before the fact chart" with the pivots set up for today. I'm buying at 1195.75, just above the daily trend line.
Initial stop at 1192.75.
Will see what the market has for us, and as always, the market has the last word and in due time will show us the way.
I see for you the same I see for my self: Having the best of luck and fun, awesome profitable trading day!
Click image for original size
Emini Day Trading /
Daily Notes /
Forecast /
Economic Events /
Search /
Terms and Conditions /
Disclaimer /
Books /
Online Books /
Site Map /
Contact /
Privacy Policy /
Links /
About /
Day Trading Forum /
Investment Calculators /
Pivot Point Calculator /
Market Profile Generator /
Fibonacci Calculator /
Mailing List /
Advertise Here /
Articles /
Financial Terms /
Brokers /
Software /
Holidays /
Stock Split Calendar /
Mortgage Calculator /
Donate
Copyright © 2004-2023, MyPivots. All rights reserved.
Copyright © 2004-2023, MyPivots. All rights reserved.